
Claude Code × Medical Application
[Claude Code] Treatment Pathways on One Page, Part 2: Designing the Chart — Keeping Order and Colours Fixed While You Focus
1. Introduction — if the chart is repainted every time you focus, you cannot compare
As we saw in Part 0, the Treatment Line Sankey Diagram lets you click a node or ribbon in the chart to focus on just that group of patients. If you build this the obvious way, the following happens.
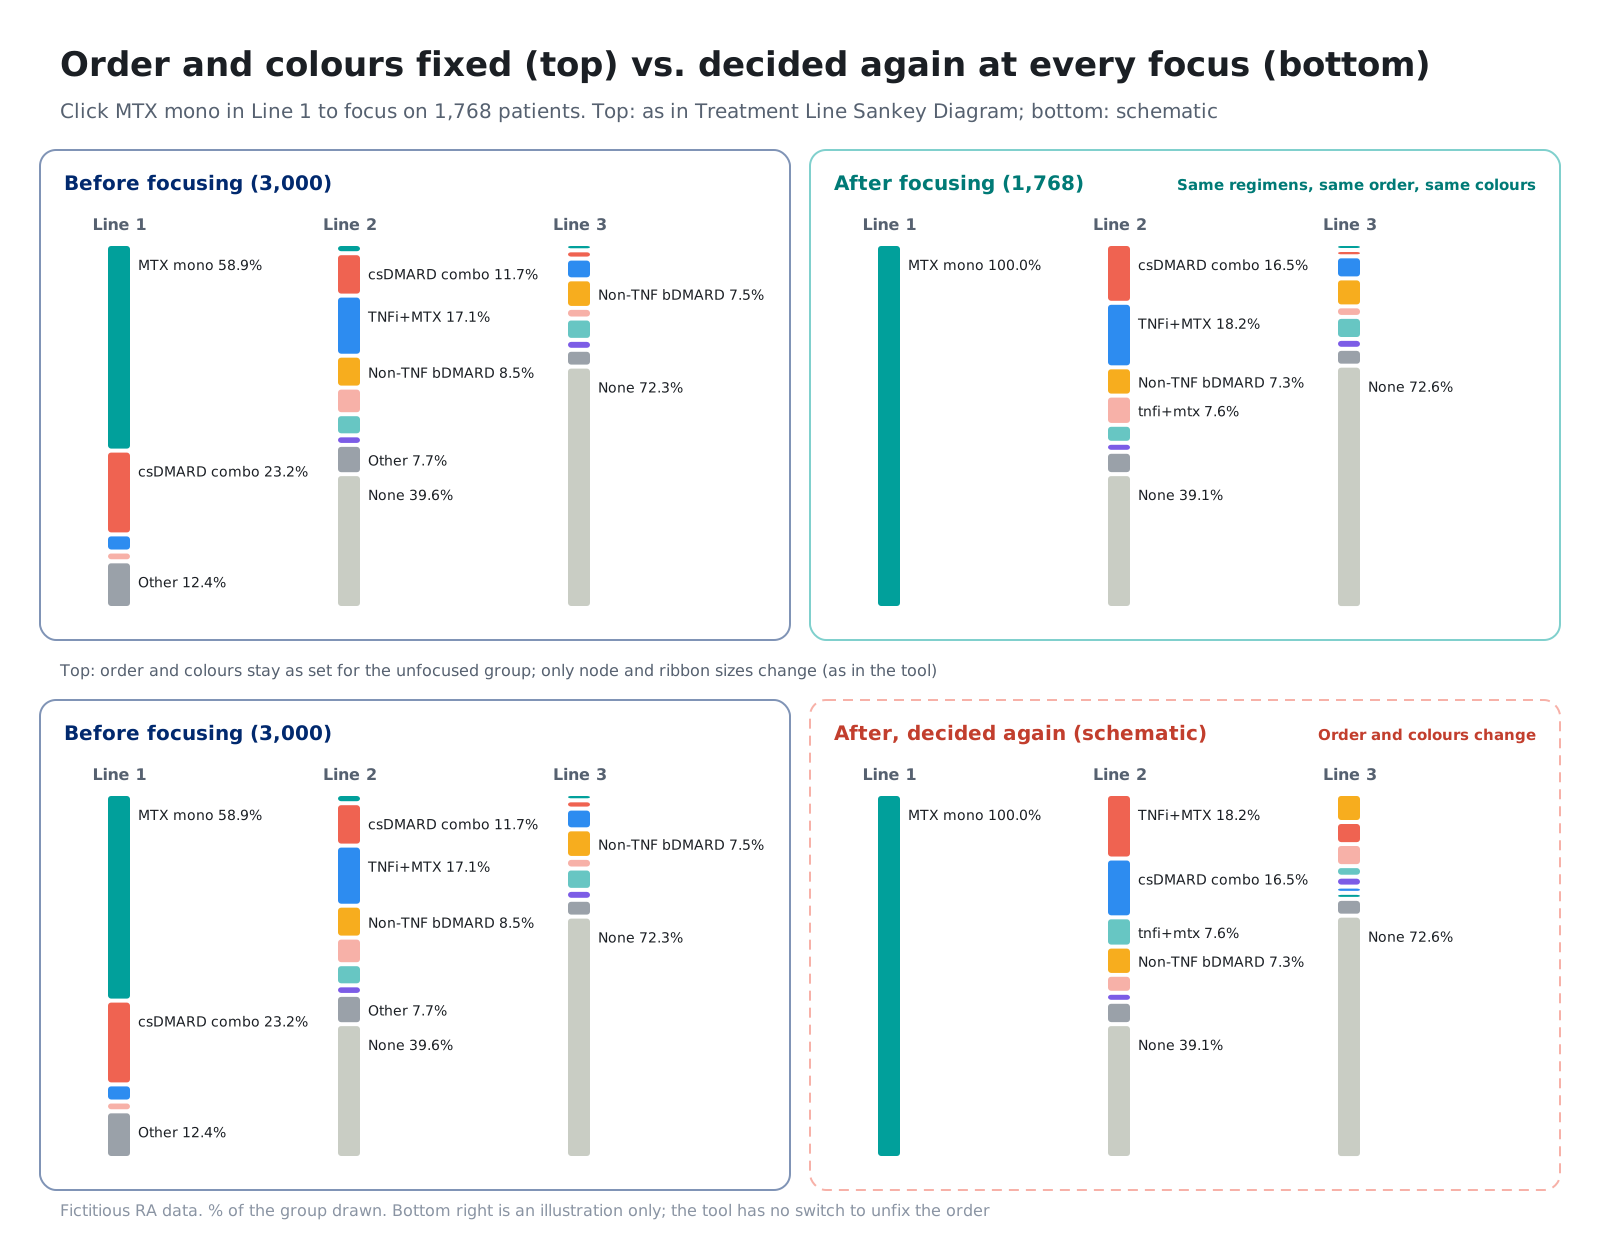
- Nodes are re-sorted by patient count within the focused cohort, so their vertical order changes
- Colours are reassigned by patient count, so the same treatment changes colour
- The line for “grouping rare treatments into Other” is redrawn for each cohort, so a node that was there a moment ago vanishes into Other
Each of these is natural if you only look at that cohort. But it is a problem when you want to compare the chart before and after focusing. A chart in which the same treatment appears in a different place and a different colour cannot be compared.
This post goes through the design that keeps the chart comparable, step by step.
- Fixing order, colours and Other “before focusing”
- The line for grouping rare treatments into Other
- Up to 8 colours — how the palette was checked
- How the order is decided
- The percentage base — all patients or patients reaching the line
- Views other than the chart
- The limits of this design
- 1,768patientsthe number left after clicking first-line MTX monotherapy to focus (fictitious data, out of 3,000)
- 2%the default line for grouping rare treatments into Other
- 8coloursthe maximum number of colours assigned to treatments
- 2optionsfor the percentage base (all patients, patients reaching the line)
2. Fixing order, colours and Other “before focusing”
2-1. Separating the cohort that decides from the cohort that is drawn
When the Treatment Line Sankey Diagram builds a chart, it handles two cohorts separately.
| Cohort that decides | Cohort that is drawn | |
|---|---|---|
| Contents | The cohort after filters (age, site, etc.) are applied, before clicking to focus | The cohort after clicking to focus |
| Used for | Grouping into Other, the order of the nodes, assigning colours | The thickness of nodes and ribbons, patient counts, percentages |
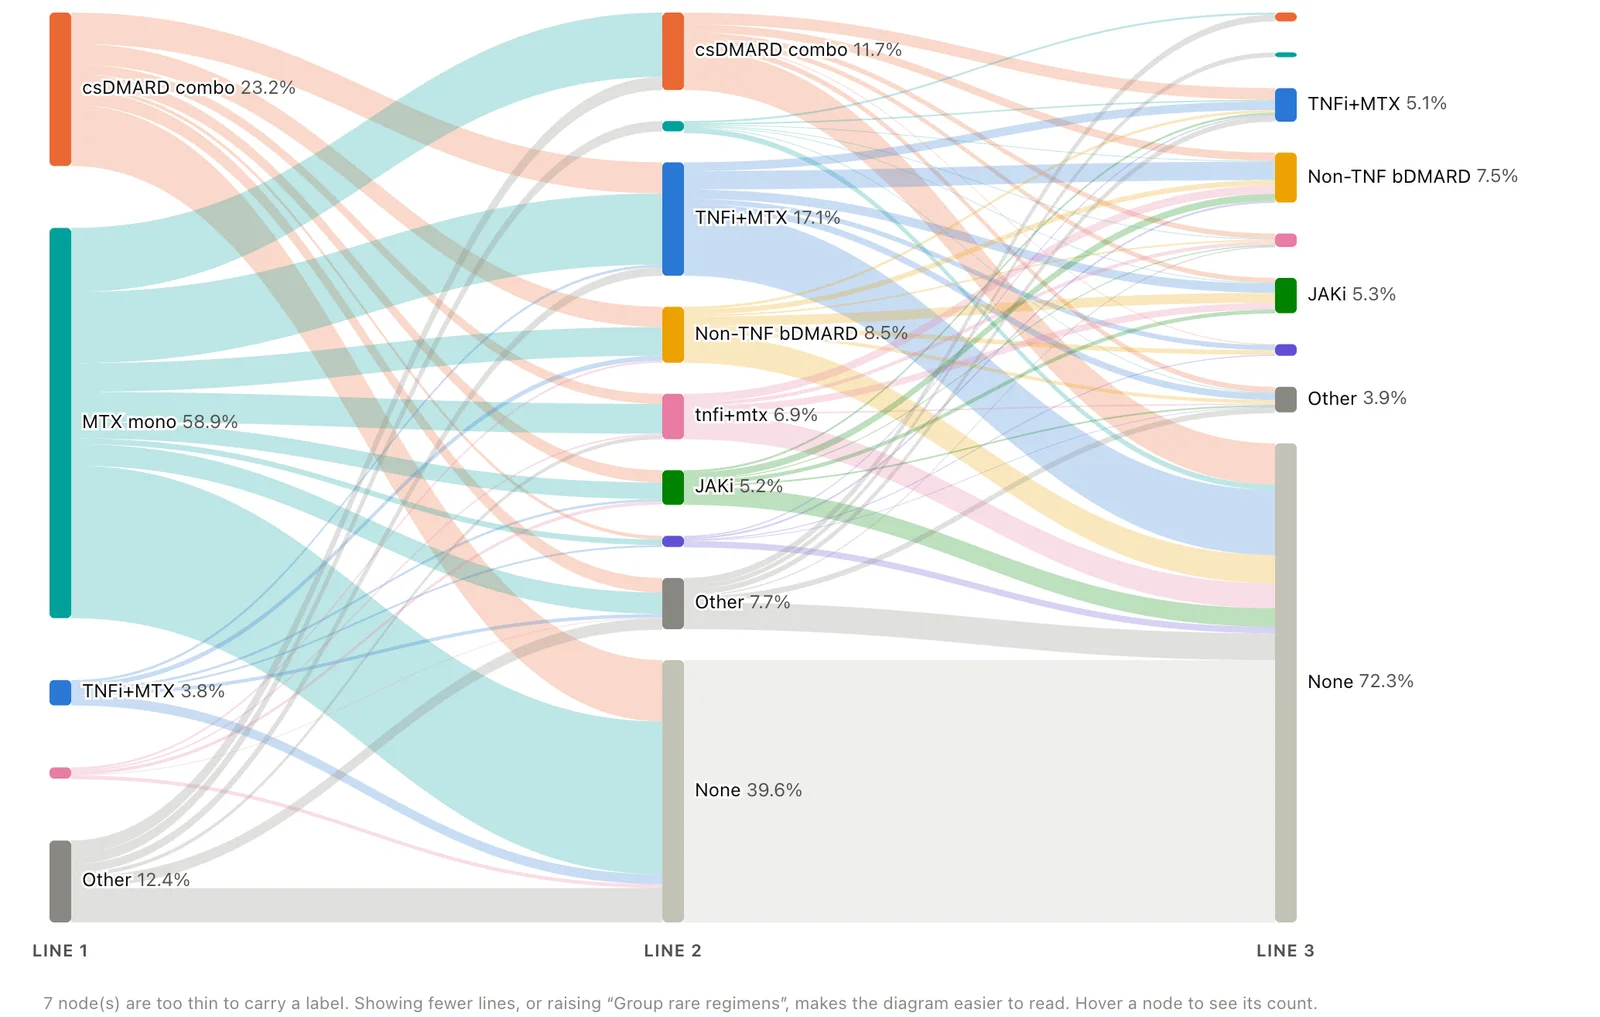
Clicking to focus does not change the “cohort that decides”, so the order, colours and grouping into Other stay as they were. Only the thickness of the nodes and ribbons changes.
2-2. The actual screen
In the fictitious data (3,000 patients), clicking the first-line MTX monotherapy node focuses the chart on 1,768 patients.
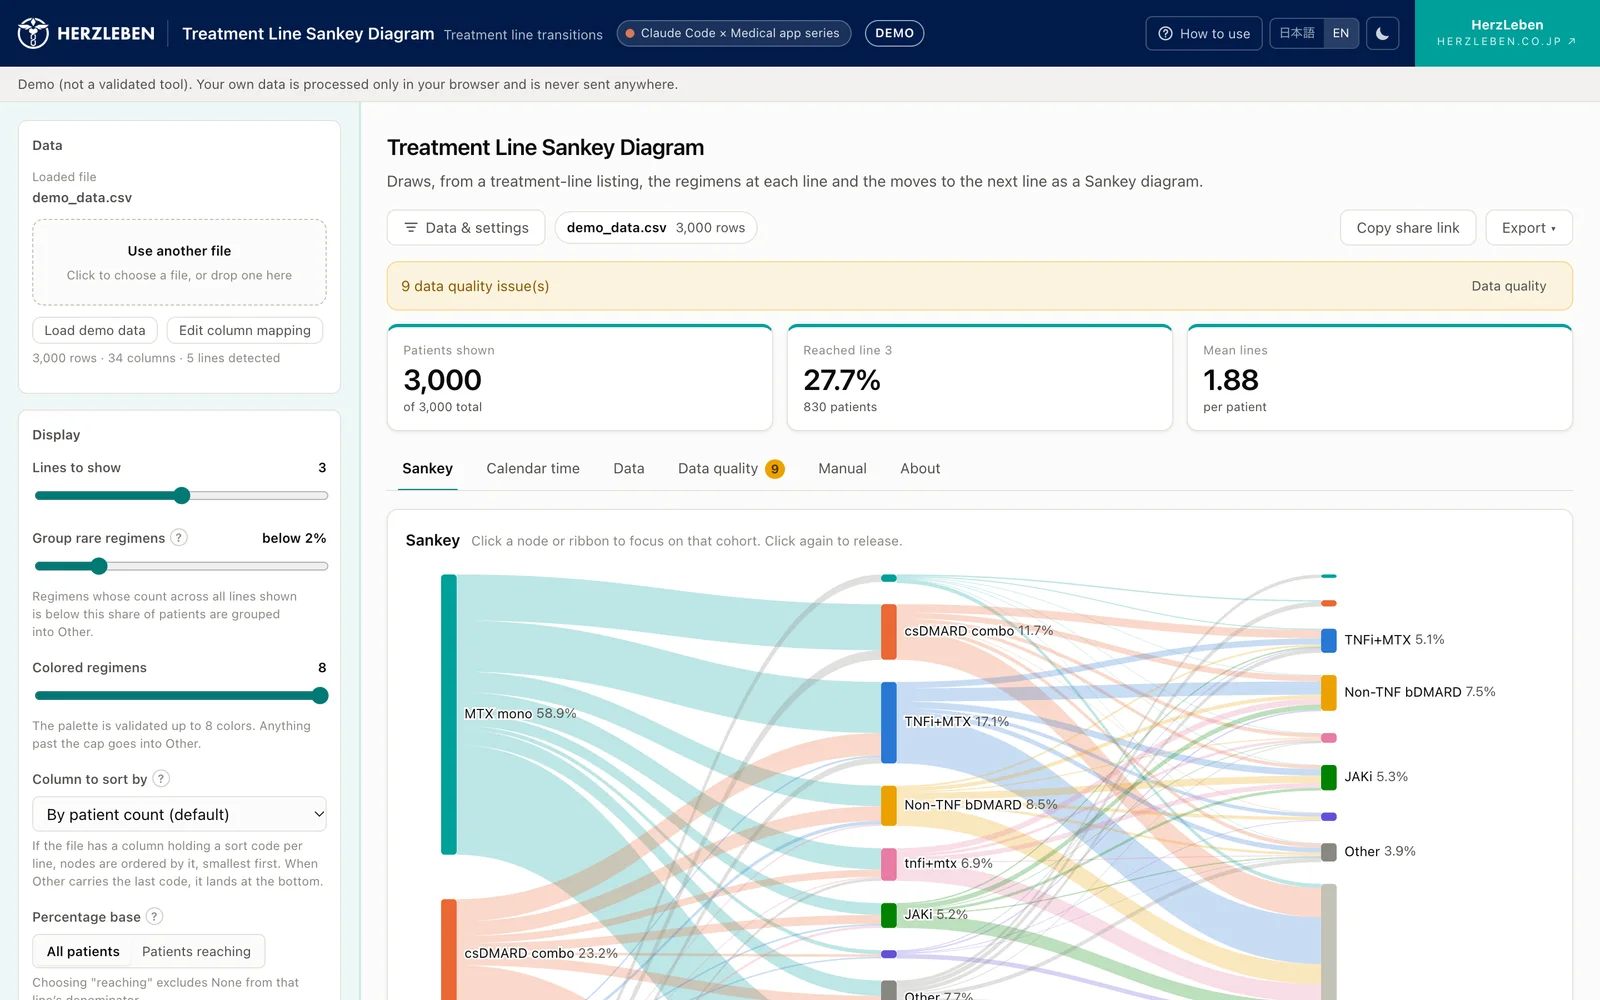
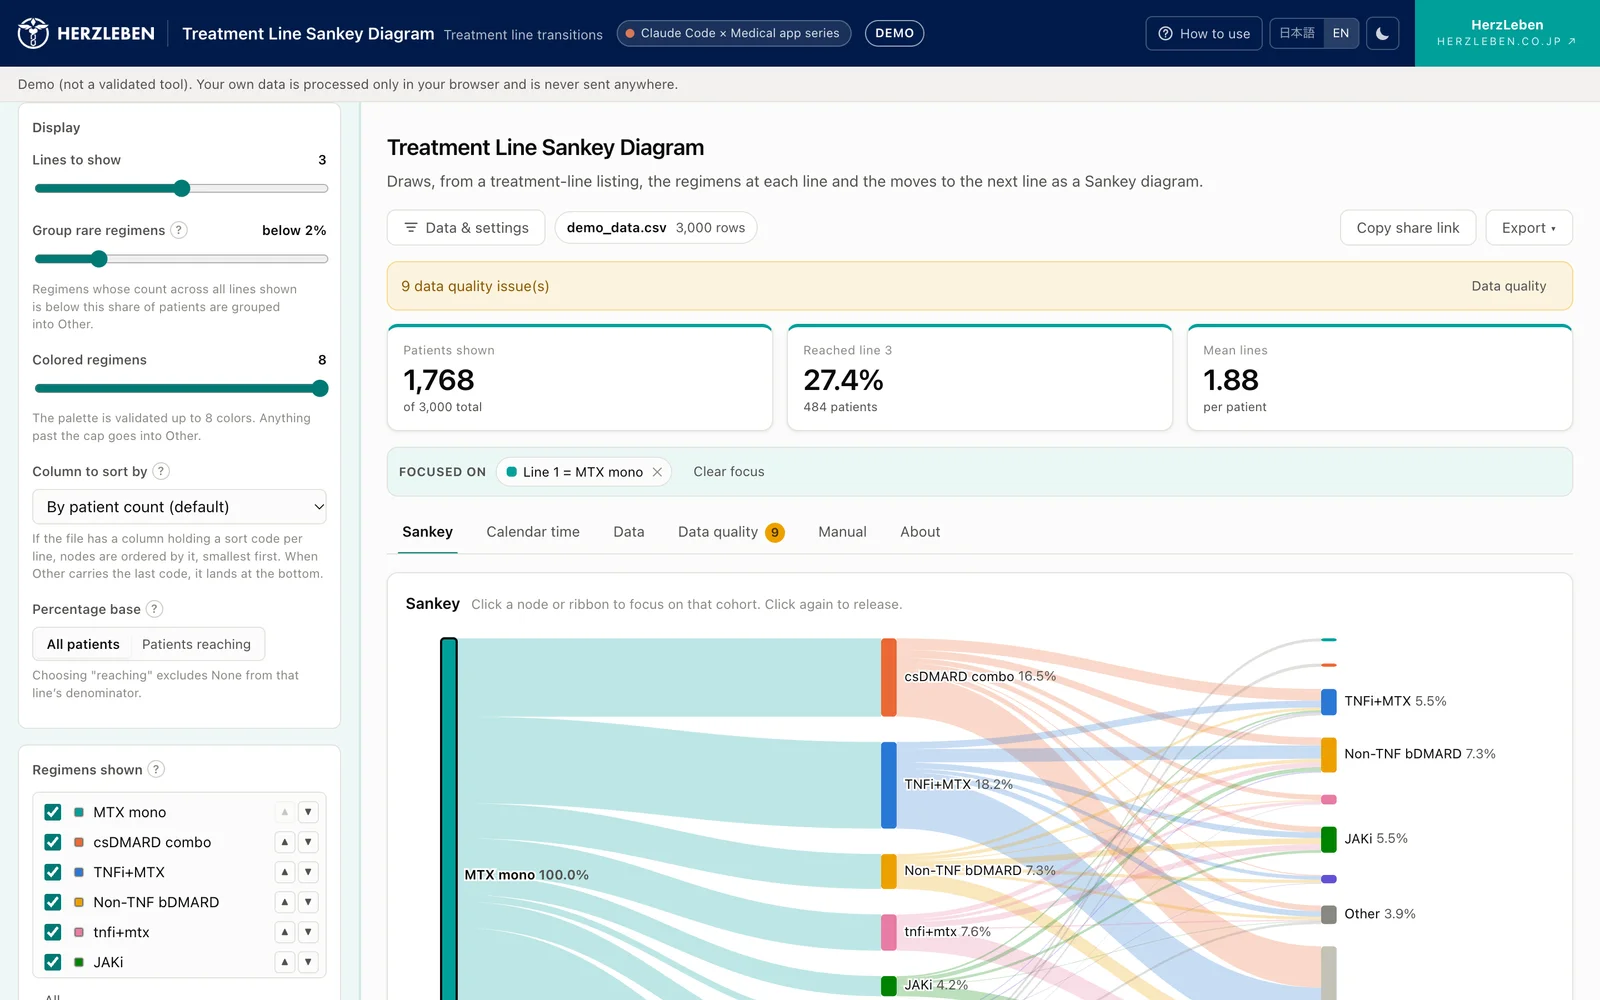
The focus conditions are shown together above the chart, and each can be removed with ✕. Clicking another node in the same line replaces the previous focus. One patient never receives two treatments in the same line, so combining them would leave no one.
2-3. The focus carries over to exports
The focused state carries over as it is to the tables, the “Calendar time” tab and the PNG, SVG and CSV exports. This avoids a mismatch in which only the chart is focused while the tables still show everyone.
3. The line for grouping rare treatments into Other
3-1. The rule for grouping
If every treatment with few patients gets its own node, thin ribbons multiply and the chart becomes unreadable. So a treatment that meets either of the following is grouped into Other.
- The count of that treatment, summed across all lines shown, is below the “Group rare regimens” value (default 2%) as a share of the total
- It is beyond the maximum number of colours (default 8). Those with the fewest patients go in first
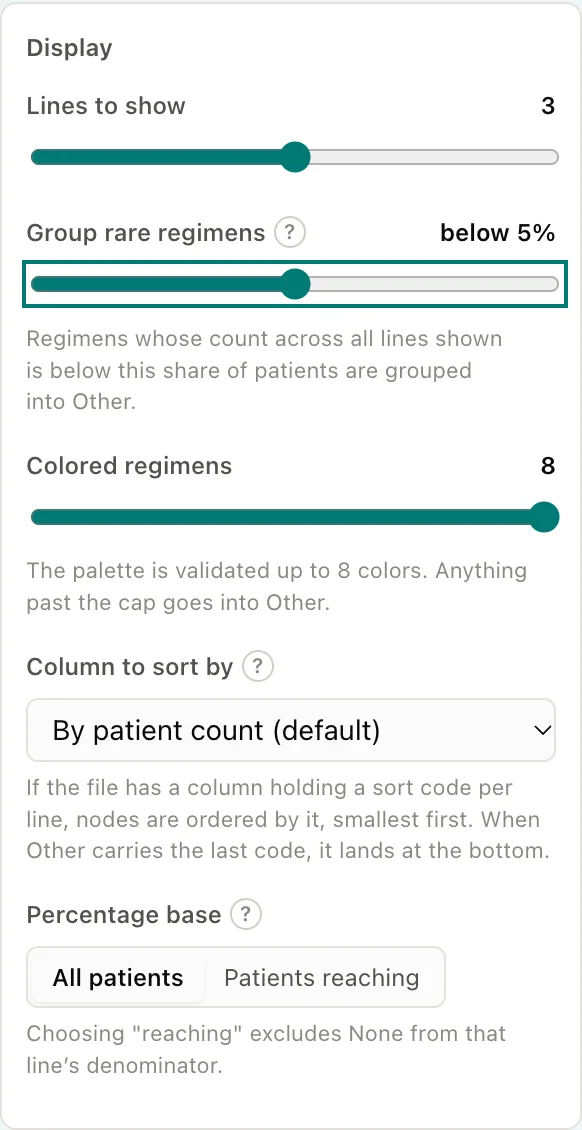
The key point is that the decision is not made line by line. If it were, the same treatment could be a node in first-line therapy and disappear into Other in third-line therapy. Then colours and order could not be kept the same across lines.
3-2. The position of the line changes the chart
In the fictitious data, moving the line from 0% to 10% gave the following.
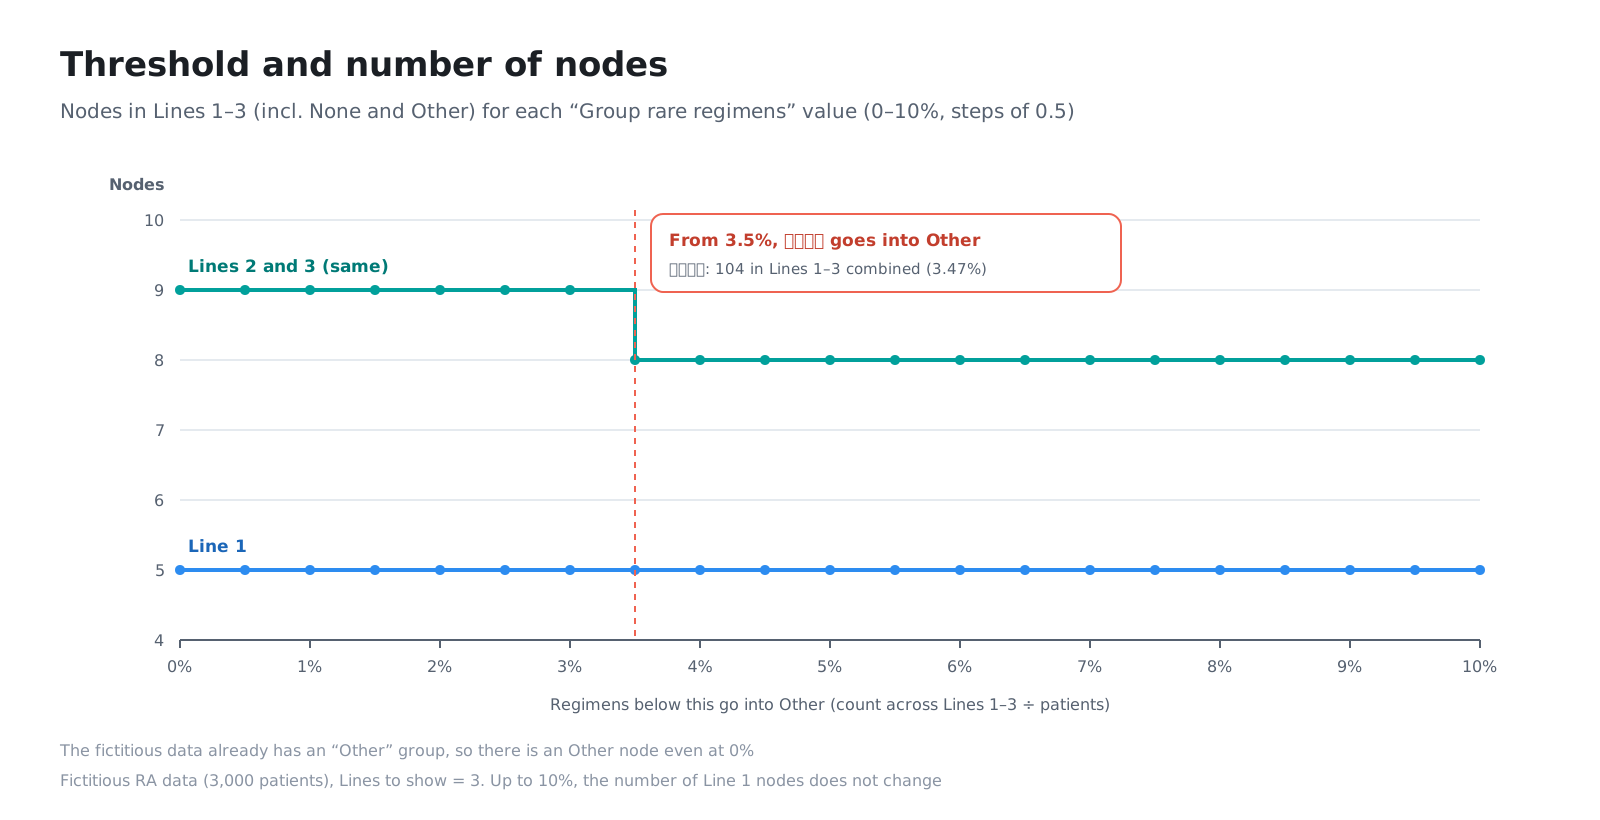
With lines shown up to Line 3, the smallest share summed over Lines 1–3 is 3.47%, for JAKi (the full-width spelling before name variants are merged).
- While the line is at 3% or below, no node goes into Other
- At 3.5%,
JAKigoes into Other, and Lines 2 and 3 drop from 9 nodes to 8 - Every other group adds up to 10% or more over Lines 1–3, so they remain even when the line is raised to 10%
Looking at Line 1 alone, tnfi+mtx is only 1.7%. It still remains as a node because it adds up to 10.6% over Lines 1–3. This is the case described in 3-1: “rare in one line, but not grouped into Other”.
3-3. Always look inside Other
Grouping into Other makes the chart easier to read, but there is a risk that clinically important treatments get buried in Other. Newly launched drugs have few patients at first, which makes them exactly the kind of treatment that tends to land in Other.
So opening “N regimens in Other” in the sidebar shows a list of what was grouped. Please check it before showing the chart to anyone.
4. Up to 8 colours — how the palette was checked
4-1. Why 8 colours
The maximum number of assigned colours is 8 because the palette has only been checked up to 8 colours. Adding a ninth makes it hard to tell apart from one of the others.
The 8 colours were chosen against the following criteria and checked by calculation.
| Criterion | How it was checked |
|---|---|
| Distinguishable with colour vision deficiency | The appearance under protan and deutan vision was calculated with a published formula (Machado et al. 2009), and the difference between neighbouring colours exceeds the guideline value (minimum 13.8) |
| Distinguishable from the background | The contrast with the background was calculated for both light and dark backgrounds |
| Including the company colour | The first colour is HerzLeben’s teal |
With 8 colours, it is not possible to make every pair of colours easy to distinguish at once. In the Sankey diagram, nodes carry their names and percentages directly, there are gaps between ribbons, and there is a legend and tables, so we used how easily neighbouring colours can be told apart as the criterion.
4-2. Text does not rely on colour
The text for node names and percentages has a contrast of at least 4.5:1 against the background (around 19:1 for names, 7.7:1 or more for percentages). When unrelated nodes are faded on mouse-over, only the shapes are faded, not the text. The degree of fading on a dark background was also calculated from the contrast values, not judged by eye.
4-3. Choosing colours yourself
Clicking a colour swatch lets you choose a different colour for that treatment. This is for when you want your own company’s drug in the company colour, or want to match the colours of a conference slide. The chosen colours are also applied to exported images.
5. How the order is decided
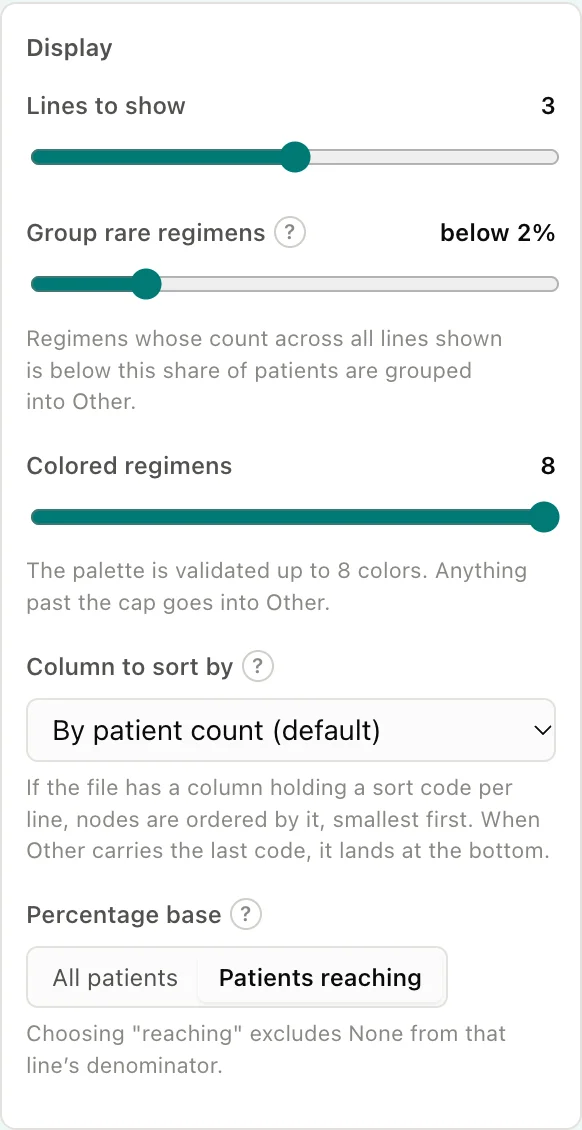
The vertical order of the nodes can be chosen from three options.
| Ordering | What it does |
|---|---|
| By patient count (default) | Most patients first. Other and None (patients who did not reach that line) go at the very bottom |
| Manual order | Move items up and down with ▲▼ in the list. The order is stored in the share link and kept even when you change the number of lines shown |
| Sort-code column | If there is a column that holds a sort code for each line (tx_group_1 to 5 in the fictitious data), nodes are sorted by it in ascending order |
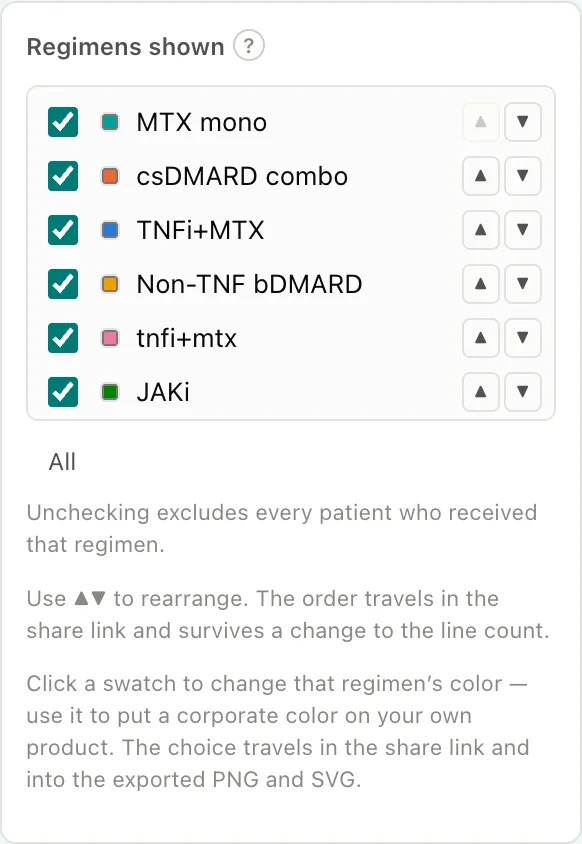
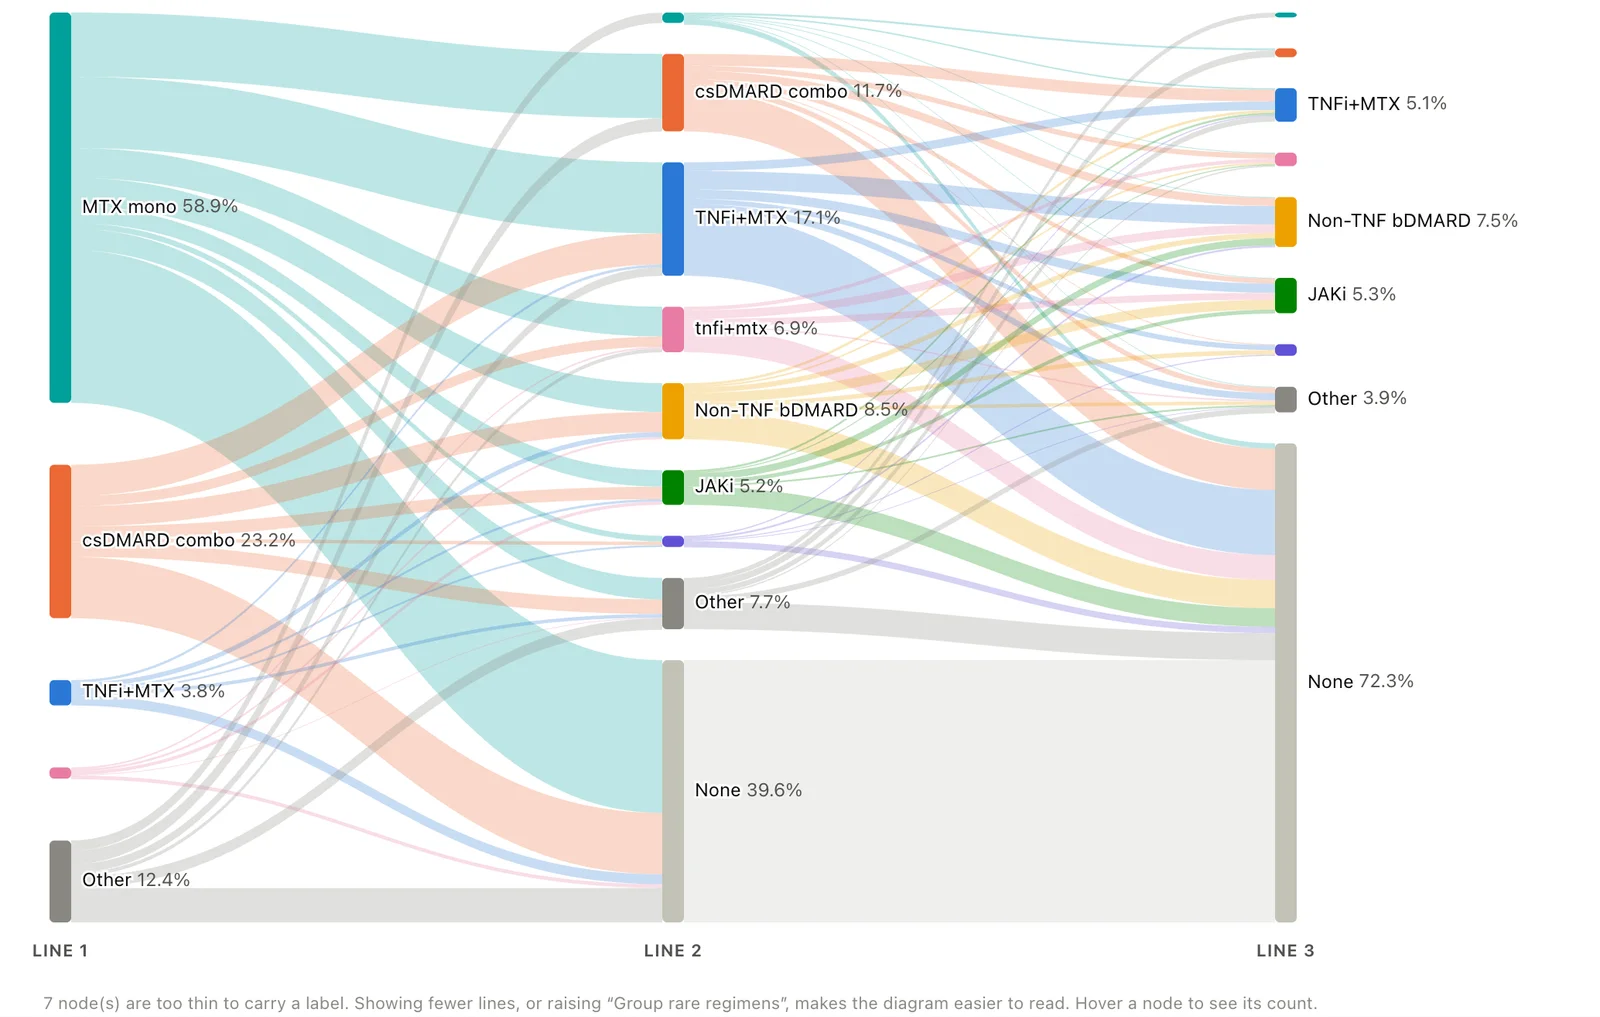
The sort code is for when you want a fixed order for a conference presentation or paper, such as “first-line therapy is csDMARD, then biologics …”.
6. The percentage base — all patients or patients reaching the line
6-1. Two bases
The percentages shown with nodes and ribbons can use one of two bases.
| Base | Percentage for a node | Percentage for a ribbon (transition) | Suited to |
|---|---|---|---|
| All patients | Divided by all visible patients | Divided by all visible patients | How many of all patients received that treatment |
| Patients reaching | Divided by the patients who were not None in that line | Divided by the patients who were not None in the line the ribbon leaves (the from line) | Which treatments are most common among patients who reached third-line therapy |
Even for the same third-line node, the percentage is small with all patients as the base and large with patients reaching the line as the base (see 5-1 of the reference page).
With patients reaching the line as the base, no percentage is shown for ribbons leaving None (patients who did not reach that line). A percentage “among those who did not reach the line” has no meaning. This is the same treatment as for the None node.
6-2. State the base in the tables and the CSV
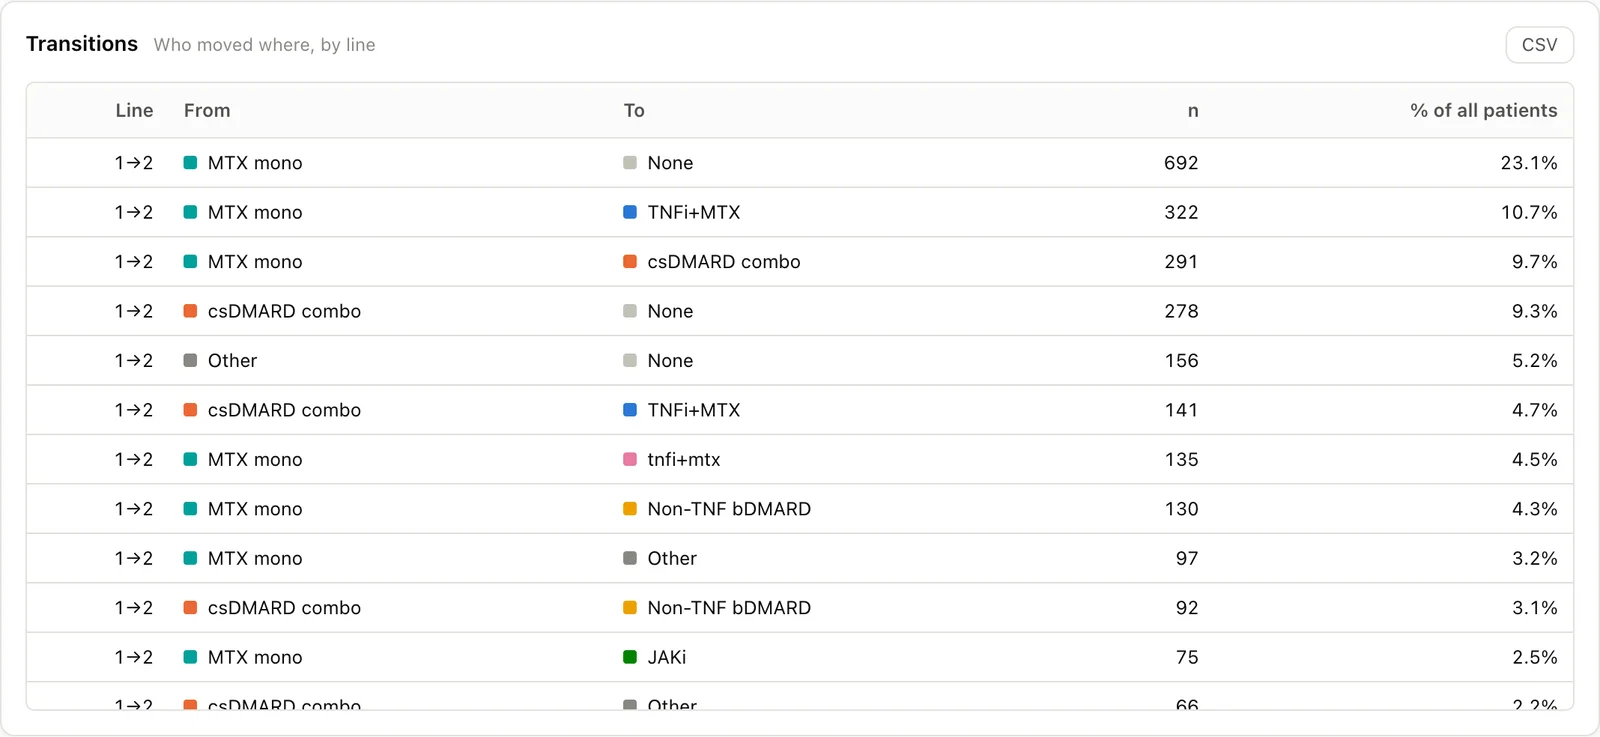
Please do not quote a percentage without saying which base it uses. For that reason, the headers of the percentage columns in the “Node summary” and “Transitions” tables state the base.
- “% of all patients”
- “% of patients reaching the line” (Node summary)
- “% of patients reaching the from line” (Transitions)
In the exported CSV as well, the percentage columns are named separately as pct_of_all (all patients) and pct_of_reached (patients reaching the line). This way the base is clear even if only the CSV is pasted into another document.
7. Views other than the chart
For things that are hard to read from the chart alone, the same cohort can also be viewed in other forms.
- Calendar time: how the choice of treatment changed according to when first-line therapy began
- Node summary: patient counts and percentages for each line
- Transitions: how many patients moved from which treatment in one line to which treatment in the next line (6-2)
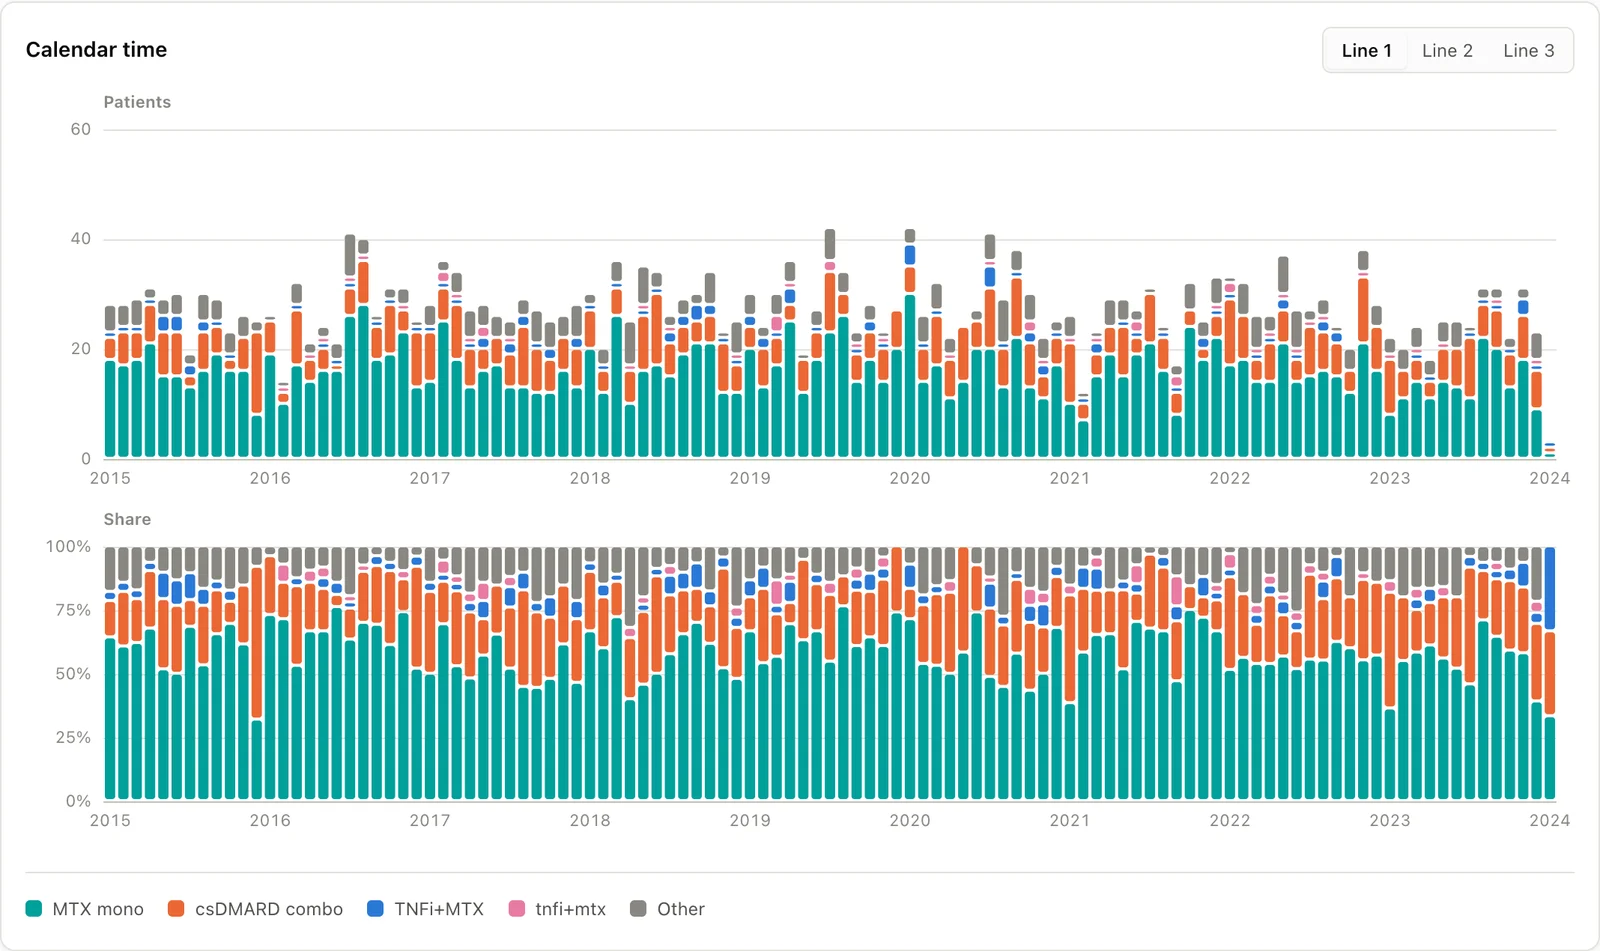
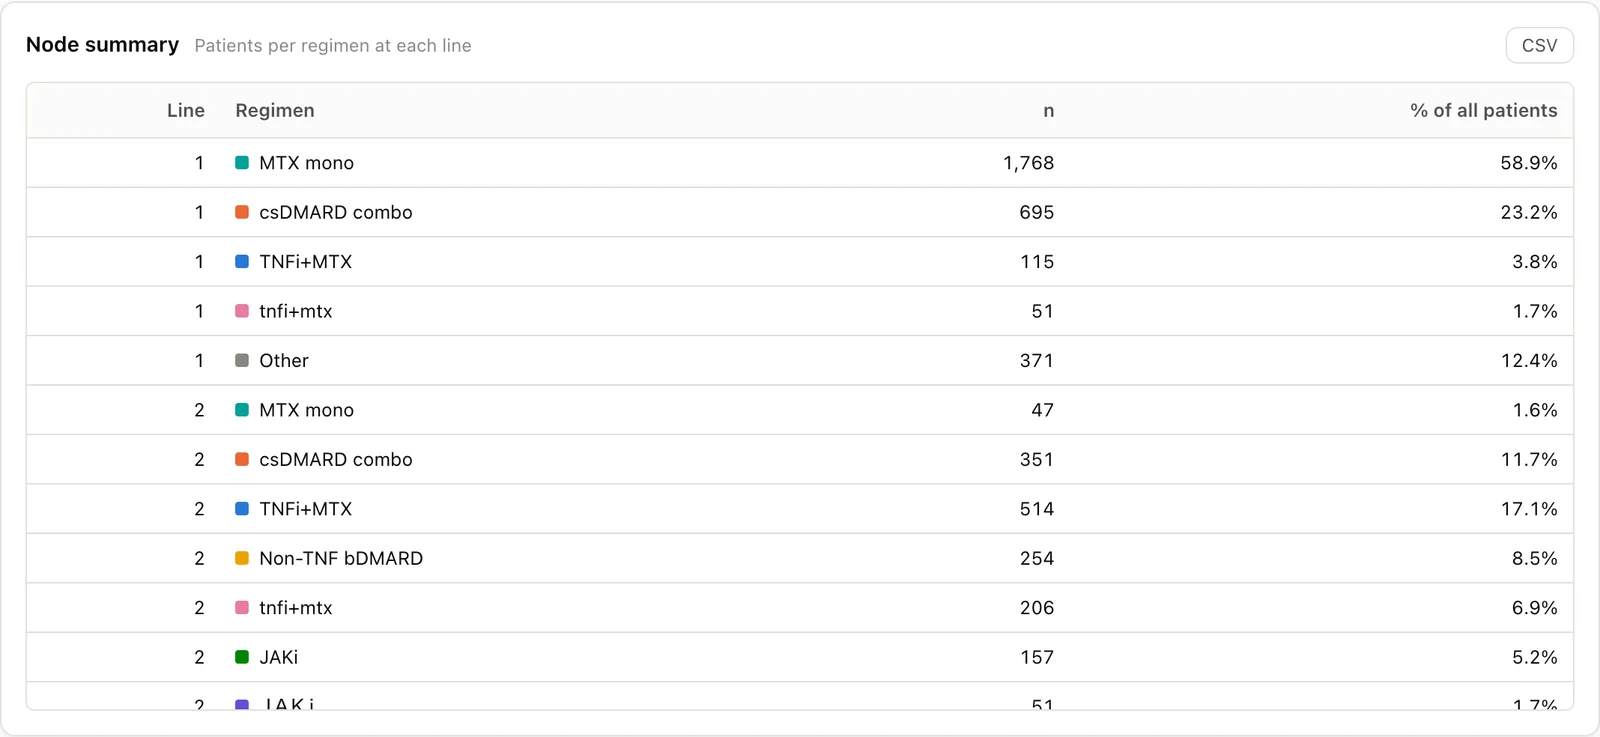
When quoting numbers in a document, use the numbers in the tables or the exported CSV rather than reading them off the chart by eye.
8. The limits of this design
| Case | What happens |
|---|---|
| The focused cohort is small | Order and colours stay as decided for the whole cohort, so a treatment that hardly appears in the focused cohort may sit near the top |
| A treatment rare in only one line | Grouping into Other is decided by the counts across all lines, so it remains as a node even if it is very rare in that line (3-1) |
| Filters are changed | Filters change the “cohort that decides”, so order, colours and Other are decided again. This is handled differently from focusing by clicking |
| You want to distinguish 9 or more treatments | There are not enough colours, so those with the fewest patients go into Other. Show fewer lines, or review the group names |
| Ribbons remember only the previous line | A ribbon from second to third line does not distinguish what was used in first line. To find out, click the first-line node to focus (see 5-4 of the reference page) |
9. What we left to Claude Code, and what people decided
| Left to Claude Code | Decided by people |
|---|---|
| Calculating the layout of the Sankey diagram and drawing it | Fixing order, colours and Other on the cohort before focusing |
| Implementing how counts are tallied for grouping into Other, and the text explaining it | Deciding across all lines shown, not line by line |
| Calculating candidate palettes (colour vision and contrast) | Limiting colours to 8, and using neighbouring colours as the criterion |
| Calculating the degree of fading on a dark background | Fading only the shapes, not the text |
| Implementing the rule that identifies sort-code columns | Not offering columns that would give a meaningless order |
| Carrying the focus over to the tables, Calendar time and exports | Offering two percentage bases, and always stating the base in table headers and CSV column names |
Palette calculations and fading values are more accurate when left to Claude Code. On the other hand, what should be easy to compare, and where to draw the line, had to be decided by people who know the situations in which the chart is used.
10. Summary
- If the order or colours of the chart change every time you focus, you cannot compare before and after
- Order, colours and grouping into Other are decided on the cohort after filters are applied and before clicking to focus, and they do not change when you focus. Only the thickness of the ribbons changes
- Rare treatments below 2% of the count across all lines shown are grouped into Other. The position of the line changes the chart, so always look inside Other
- Colours are limited to 8, checked by calculation for colour vision and contrast. Text does not rely on colour and keeps a contrast of at least 4.5:1
- There are two percentage bases, all patients and patients reaching the line. Table headers and CSV column names state which base is used
A chart you can compare is a chart that stays still. The only thing we let move is the thickness of the ribbons.
Next steps
Part 3 covers how you can say that the patient counts in the chart are correct. It presents answer-keyed fictitious patient data, deliberately broken input and how name variants are merged (by rules and by AI), together with the results of checking them against the answers.
Sources
- Machado GM, Oliveira MM, Fernandes LAF. A Physiologically-based Model for Simulation of Color Vision Deficiency. IEEE Transactions on Visualization and Computer Graphics. 2009;15(6):1291-8.
- The screenshots and figures on this page come from fictitious rheumatoid arthritis data (3,000 patients). They are not related to any real patient, site, drug or company