


TIPS

Every step, written down.

How we build healthcare data apps with generative AI — run for real, with no steps skipped. More articles are available in Japanese.

Claude Certified Architect – FoundationsClaude Certified Architect – ProfessionalWritten by an Anthropic Claude Certified Architect (Foundations & Professional)

FEATURED SERIES

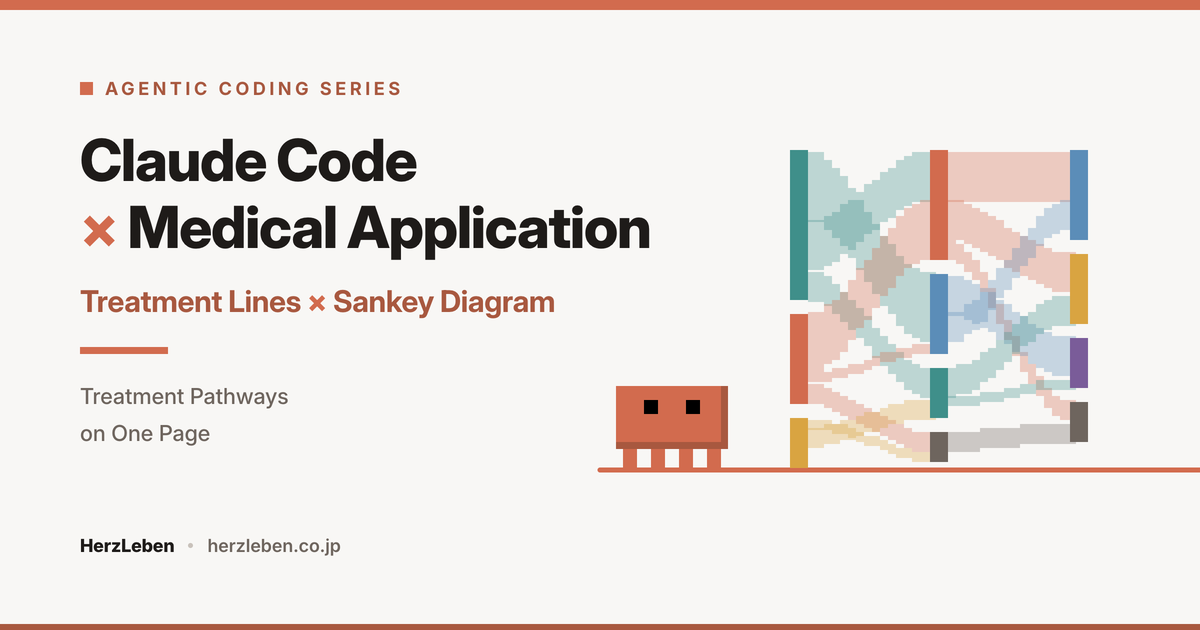
Treatment Pathways on One Page
— Claude Code × Lines of Therapy

Sankey diagrams showing how patients move between lines of therapy have usually been drawn by writing code in R or Python. The Treatment Line Sankey Diagram turns an analysis listing into a Sankey diagram just by loading it, and lets you focus on patient groups by clicking. This post covers where it is used, how it differs from the usual approach, what it does, the design that makes it safe to use, and an overview of the series.

  1. Part 0Overview and Design
  2. Part 1Loading the Data — Reading Analysis Listings As They Are
  3. Part 2Designing the Chart — Keeping Order and Colours Fixed While You Focus
  4. Part 3Verifying the Results — Fictitious Patient Data with the Answers Set First
  5. Part 4Building In the AI — Only Column Names and Regimen Names Are SentComing soon

More series4

From In-House BI to an AI Dashboard— Claude Code × Japan's DPC Open Data

Can the BI dashboards that companies build in Tableau or Power BI, for sales trends, area maps and more, become AI dashboards you can simply talk to? We tried it on Japan's public DPC open data (FY2022–FY2024, 6,448 hospitals). This post covers what changes, what the screens look like, how the AI is kept from making up numbers, and an outline of how we built it with Claude Code.

  1. Part 0
  2. Part 1
  3. Part 2
  4. Part 3
  5. Part 4
  6. 5 of 5 published

Read the seriesApp

Articles7

日本語の記事一覧 →