
Claude Code × Medical Application
[Explainer] What Is Medicare Part D — The Basics of the Free U.S. "Prescriber × Drug" Dataset
1. What this page is for
This is a reference page that explains the data used in the “Medicare Part D × Text-to-SQL” series, separately from the articles themselves. The goal is to answer “What is Medicare?”, “What does the D in Part D stand for?”, and “What’s actually in the CSV?” all in one place. Each article in the series links here.
2. Medicare and Part D
2-1. Medicare is public insurance for people 65 and over
Medicare is a public health insurance program run by the U.S. federal government, covering primarily people aged 65 and over, along with some people with disabilities and patients with end-stage renal disease. It has more than 60 million enrollees and covers virtually all elderly care in the United States. It is administered by CMS (Centers for Medicare & Medicaid Services) — roughly the equivalent of Japan’s MHLW Health Insurance Bureau and the Social Insurance Medical Fee Payment Fund combined.
2-2. The four parts
Medicare is divided into four parts, A through D, by type of benefit.
| Part | What it covers | Japanese equivalent |
|---|---|---|
| Part A | Inpatient stays, skilled nursing facilities, home care | Inpatient care |
| Part B | Outpatient visits, physician services, tests, drugs administered in outpatient settings | Outpatient care |
| Part C (Medicare Advantage) | Plans in which private insurers bundle A + B (usually D as well) | No equivalent (privately administered) |
| Part D | Prescription drugs picked up at a pharmacy | Dispensing |
This series uses Part D — the prescription drug benefit. It is a relatively new program, launched in 2006, in which private insurers offer the actual plans while CMS subsidizes costs and provides oversight. There are two types: standalone prescription drug plans (PDPs) and plans bundled with Medicare Advantage (MA-PDs).
2-3. Which patients appear in “Part D data”
Only prescriptions for people enrolled in Part D are included. In other words, the data covers mainly people aged 65 and over (plus some under 65 with disabilities and similar conditions), and excludes drugs administered in hospital outpatient or inpatient settings (Part B). Think of it as a view of outpatient prescribing for older adults, not all prescribing in the United States.
3. The Medicare Part D Prescribers dataset
3-1. What the data is
Since 2015, as part of its transparency policy, CMS has aggregated Part D claims by prescriber × drug × year and published them with prescriber names attached. The dataset is officially called “Medicare Part D Prescribers.” It has been updated annually since the 2013 data year, and the CY2024 data was released in May 2026.
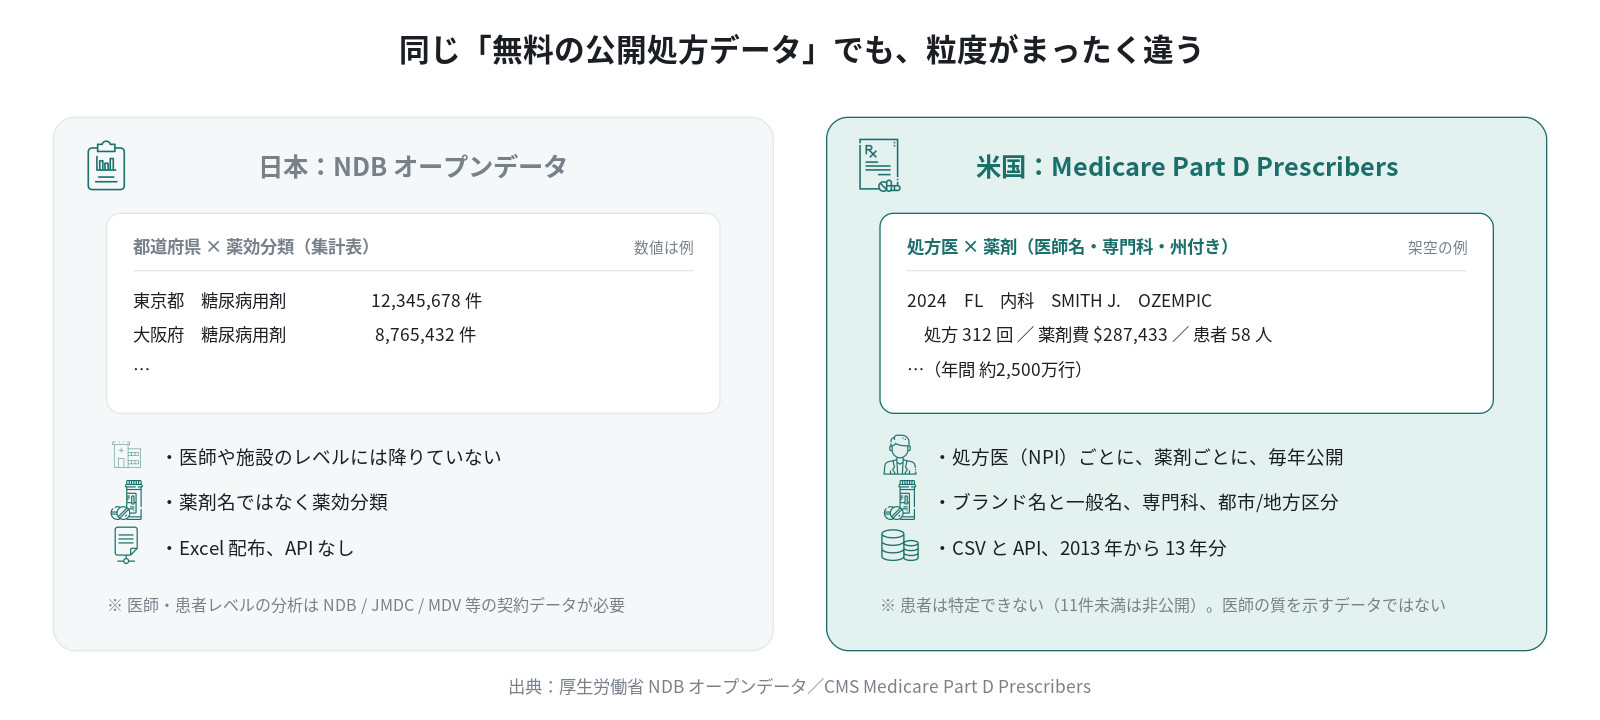
Where Japan’s NDB Open Data is a set of aggregate tables at the “prefecture × therapeutic class” level, this dataset goes all the way down to “physician × drug.” Physicians are identified by NPI (National Provider Identifier, a nationally unique 10-digit ID), with name, specialty, and location attached.
3-2. Three tables
| Table | One row represents | Rows (per year) | Purpose |
|---|---|---|---|
| by Provider and Drug | Year × prescriber (NPI) × drug | ~25 million | The main table. “Who prescribed what, and how much” |
| by Provider | Year × prescriber (NPI) | ~1.1 million | Physician profiles. Brand/generic mix, opioid prescribing rate, patient characteristics |
| by Geography and Drug | Year × geography (national, state) × drug | ~90,000 | Drug-level totals by state and nationally. Complete counts, no suppression |
All three are available as CSVs that anyone can download from data.cms.gov (APIs are also available). The main table runs to several GB for a single year, so this series loads it into BigQuery.
3-3. Key columns
These are the core columns of the main table (by Provider and Drug). Column names are exactly as they appear in the CSV.
| Column | Meaning | Notes |
|---|---|---|
| Prscrbr_NPI | Prescriber’s NPI | Treat as a string — leading zeros occur |
| Prscrbr_Last_Org_Name / Prscrbr_First_Name | Physician’s last and first name (organization name if an organization) | |
| Prscrbr_State_Abrvtn | State (abbreviation) | 50 states + DC, plus PR (Puerto Rico) and XX (unknown) |
| Prscrbr_Type | Specialty | About 200 values. Inconsistent naming |
| Brnd_Name / Gnrc_Name | Brand name / generic name | There is no therapeutic class column (you need your own dictionary) |
| Tot_Clms | Number of claims | New fills + refills |
| Tot_30day_Fills | 30-day standardized fill count | Use this when comparing prescribing volume |
| Tot_Day_Suply | Total days supply | |
| Tot_Drug_Cst | Total drug cost (USD) | Before rebates. Sum of plan, patient, and government subsidy payments |
| Tot_Benes | Number of beneficiaries (unique) | Blank when 1–10 |
| GE65_* | Breakout for ages 65 and over | The same metrics, restricted to beneficiaries 65 and over |
The by Provider table (physician summary) adds columns such as:
- Claim counts and costs for brand, generic, and other drugs (Brnd_, Gnrc_, Othr_*)
- Claim counts and prescribing rates for opioids, long-acting opioids, antibiotics, and antipsychotics (65 and over)
- Urban/rural classification (Prscrbr_RUCA: 1 = metropolitan core, 10 = isolated rural)
- Characteristics of the physician’s patient panel: average age, age bands, sex, race, dual Medicaid eligibility, average risk score
The by Geography and Drug table includes patient out-of-pocket costs (LIS_Bene_Cst_Shr, NonLIS_Bene_Cst_Shr) — information not found in the other two tables.
4. Ground rules for reading the data
4-1. Counts under 11 are suppressed
To protect patient privacy, values of 1–10 are left blank, and in the main table, rows for a physician × drug combination with fewer than 11 claims do not exist at all. Values that could be back-calculated from other breakouts are also hidden (complementary suppression). The reason for suppression is indicated with flags: * (the value is 1–10) and # (suppressed to prevent back-calculation).
The implication is that summing the main table will not give you total prescribing for a drug. When you need complete counts, use by Geography and Drug. The app in this series displays “the number of rows missing due to suppression” alongside query results precisely to make this pitfall visible.
4-2. Costs are before rebates
Tot_Drug_Cst is the total amount billed — ingredient cost plus dispensing fee plus tax — and does not reflect rebates (discounts) paid by manufacturers to plans. Rebates are larger for brand drugs, so those costs look higher than the actual burden. Note this caveat whenever you present a “top 10 by cost” list.
4-3. Compare prescribing volume using Tot_30day_Fills
Tot_Clms (claim count) counts a 30-day supply and a 90-day supply each as one claim. To compare prescribing volume, use Tot_30day_Fills, which divides each claim’s days supply by 30 and sums the result.
4-4. This is not data for measuring physician quality
As CMS itself states explicitly, this data is not intended to evaluate the quality of care delivered by individual physicians. Prescribing patterns vary widely by specialty and patient population. When this series presents rankings of individual physicians, it includes the NPI and a disclaimer.
5. What you can and can’t do
What you can do
- Regional uptake of new drugs: which states, which specialties, which years grew
- Cost structure: top drugs by total drug cost, brand/generic mix, per-capita cost by state
- Prescribing concentration: what share of a drug is prescribed by the top X% of physicians
- Prescribing patterns by specialty
- Urban vs. rural differences (RUCA)
- Patient out-of-pocket costs (by state and drug)
What you can’t do
- Patient-level tracking (line-of-therapy switches, combination use, adherence) — the data is pre-aggregated with no patient IDs
- Monthly seasonality — annual aggregates only
- Analysis by indication — no diagnosis information
- Drugs administered in hospitals (Part B), or prescriptions covered by non-Medicare insurance
- Physician evaluation
6. Where to get it
- The data itself: “Medicare Part D Prescribers” on data.cms.gov (each of the three tables has yearly CSVs and an API)
- Data dictionary: the Data Dictionary on each table’s page (the authoritative source for column definitions)
- Methodology: Medicare Part D Prescribers Datasets: A Methodological Overview (suppression rules, cost definitions, how specialty is assigned)
This series’ GitHub repository includes a Japanese translation of that dictionary (docs/data_dictionary.md) along with scripts for loading the data into BigQuery.
7. Summary
- Medicare is U.S. public insurance for older adults. Part D is the benefit covering prescription drugs picked up at a pharmacy
- CMS aggregates Part D claims by “prescriber × drug × year” and publishes them free of charge with physician names. Japan has no public data at this level of granularity
- Use the three tables (physician × drug, physician, geography × drug) for different purposes. Keep three things in mind — suppression below 11, costs before rebates, and 30-day standardization — and you’ll avoid most misreadings
Next steps
Text-to-SQL is a way to explore this data without writing SQL. The companion page “What is Text-to-SQL?” walks through how a question becomes SQL and how the results can be rendered as a table, a chart, or a map.
Sources
- CMS, Medicare Part D Prescribers - by Provider and Drug / by Provider / by Geography and Drug, Data Dictionary (data.cms.gov)
- CMS, Medicare Part D Prescribers Datasets: A Methodological Overview
- CMS, Medicare & You (overview of the four parts of Medicare)
- Ministry of Health, Labour and Welfare, NDB Open Data
The code is available on GitHub: github.com/HerzLeben/medicare-partd-text-to-sql