
Claude Code × Medical Application
【Claude Code】Medicare Part D × Text-to-SQL Part 0: The Big Picture and What You Can Build
1. Introduction
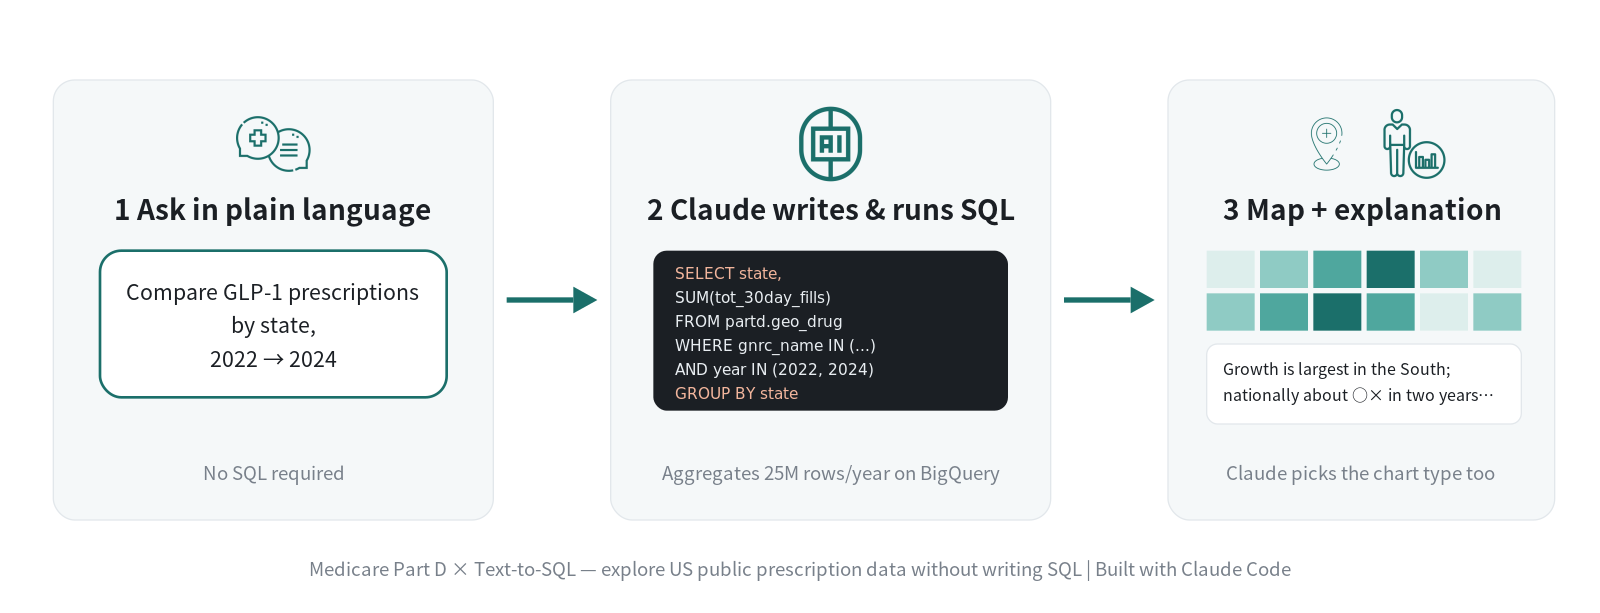
“Explore 25 million rows of US prescription data in Japanese — without writing SQL” — this five-part series walks through building exactly that app with Claude Code, all the way to publication. It’s the first entry in the series “Claude Code × Medical Application”: “Medicare Part D × Text-to-SQL.” The code is published on GitHub so you can run it in your own environment.
1-1. What the finished app looks like
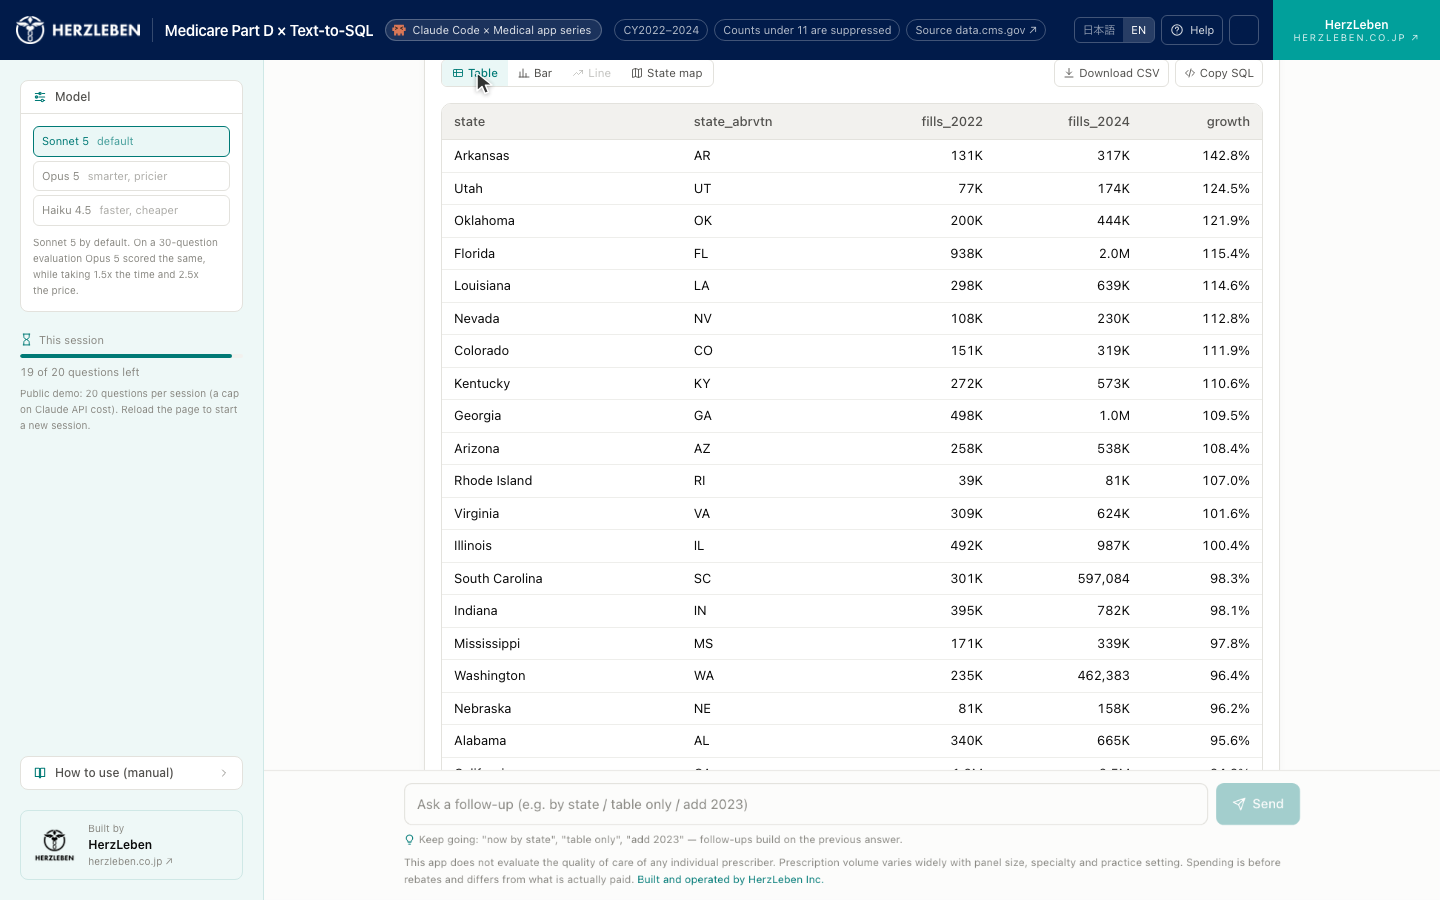
1-2. What you’ll learn in this series
| Part | Content | Video |
|---|---|---|
| 0 | The big picture and what’s possible (this article) | App walkthrough |
| 1 | Medicare Part D prescription data basics — what’s in it and what isn’t | Opening the data for real |
| 2 | Getting Claude to write SQL — a medical terminology dictionary and two tools that keep generated SQL from running unchecked | Claude Code at work |
| 3 | Building the UI and testing it with three questions — screen layout and accuracy measured over 30 questions | Running the evaluation |
| 4 | Publishing to your own GCP — Cloud Run steps (optional) | GCP setup, live |
This series is written for people in RWE, medical affairs, data science, and DX functions at pharmaceutical and medical device companies, as well as healthcare IT engineers. Being able to read SQL is enough — no need to write it — and no Google Cloud experience is assumed.
2. Why US open health data?
2-1. Japan has no public “physician × drug” dataset
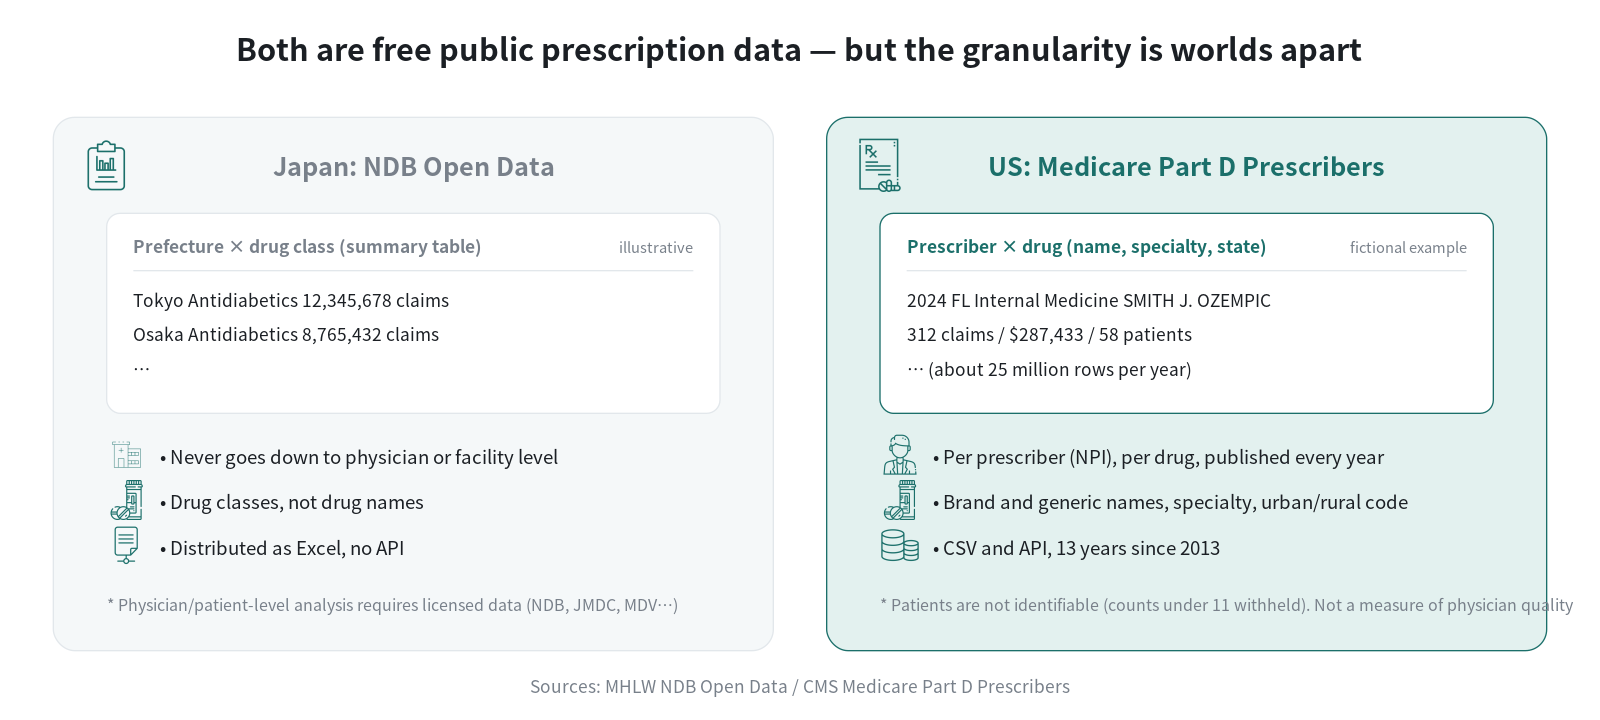
In Japan, analyzing at the physician or patient level requires contracted data such as NDB, JMDC, or MDV — there’s no way to just “try it out.” The freely available NDB Open Data comes as Excel files of prefecture × therapeutic class aggregates.
In the US, CMS (Centers for Medicare & Medicaid Services, roughly analogous to Japan’s MHLW Health Insurance Bureau) takes claims from Part D, the drug benefit of the public Medicare program, aggregates them annually by prescriber × drug, and publishes them with physician names attached. It’s part of a transparency policy that began in 2015, and the CY2024 release came out in May 2026. Thirteen years of data going back to 2013 are available to anyone as CSV.
The US is the only place where “physician-level prescription data, free, for anyone” all holds at once. Making that fact known is the first goal of this series.
2-2. What this data can show you
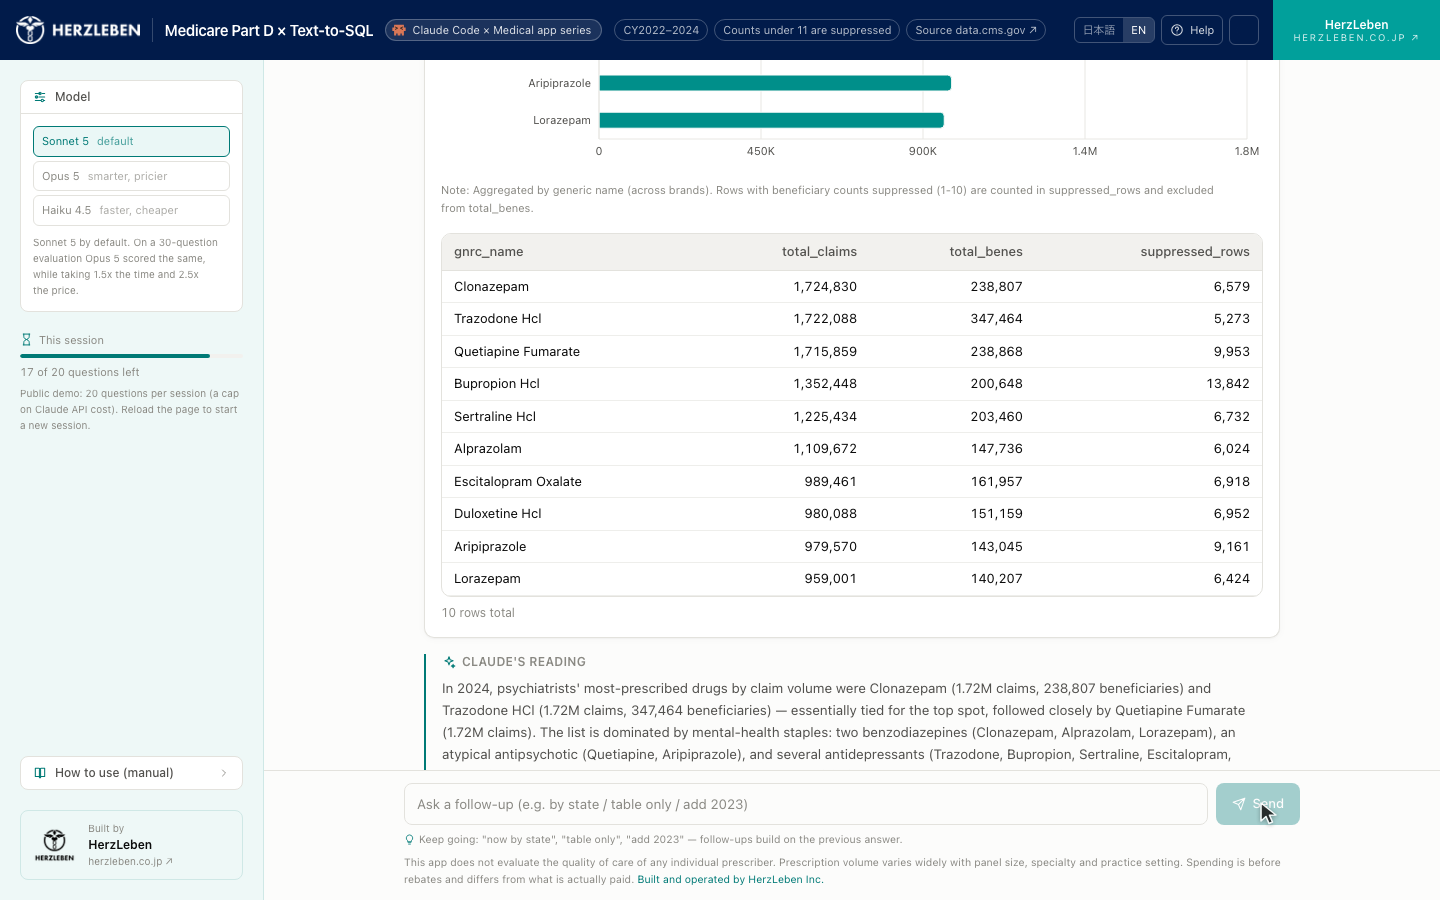
- Regional uptake of new drugs — where, in which specialties, and in which years prescription volumes for GLP-1 receptor agonists or DOACs grew
- Cost structure — top drugs by total drug spend, brand/generic ratios, per-capita drug spend by state
- Prescribing concentration — what share of a drug’s prescriptions comes from the top X% of prescribers
- Prescribing patterns by specialty — the drugs psychiatrists prescribe most, the distribution of opioid prescribing rates among internists
- Urban vs. rural differences — generic rates and prescription volumes sliced by RUCA (urban/rural classification)
On the other hand, you can’t follow individual patients (line-of-therapy switches, concomitant use, adherence), look at monthly seasonality, or analyze by indication (there’s no diagnosis information). Part 1 covers the details and the limitations.
2-3. Where this fits in pharma and life sciences
This is US data, so it can’t be applied directly to analyzing the Japanese market. Even so, it’s valuable in three situations.
① Verify US trends for global products yourself. Cross-check the numbers coming from headquarters or your US affiliate against public data. Where the press only says “rapid growth,” you can see actual prescription volumes and prescriber counts.
② Use it as a practice ground for RWD analysis. Before you start trial and error on data that requires a contract, build your instincts for cohort definitions and aggregation quirks on public data with the same structure (claims-based, pre-aggregated, with suppression). The real-world challenges — handling suppressed values, mapping brand names to generic names, inconsistent specialty labels — all show up here too.
③ Validate your design for embedding generative AI in data analysis, using public data. If you jump straight to Text-to-SQL on internal data, the data governance discussion comes first and nothing moves forward. With public data, you can settle prompt design, guardrails, and how to measure accuracy up front. This third point is the main theme of the series.
3. What we’ll build in this series
3-1. What the app does
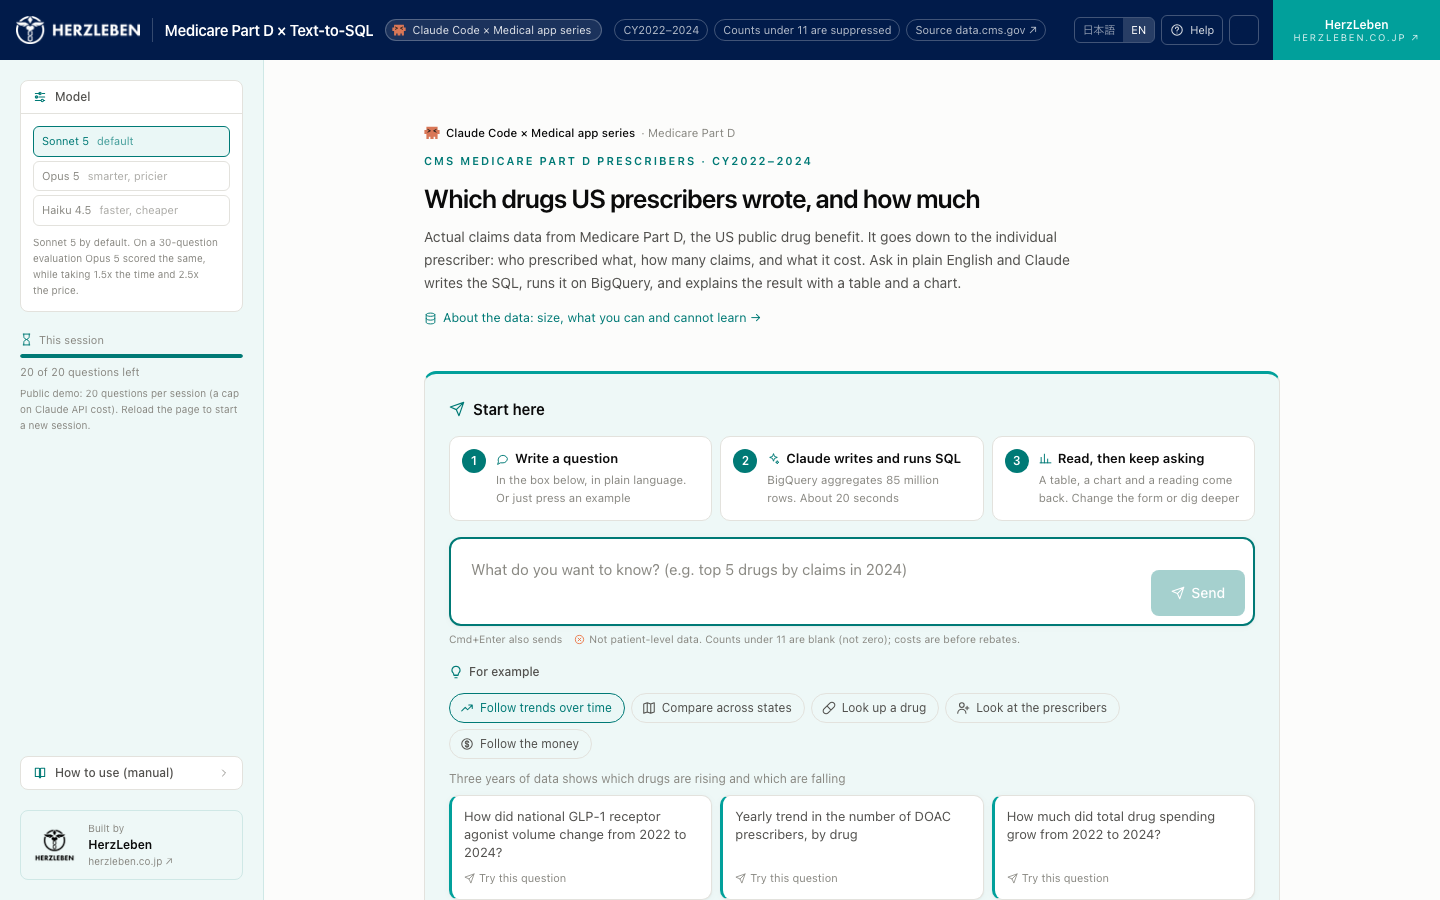
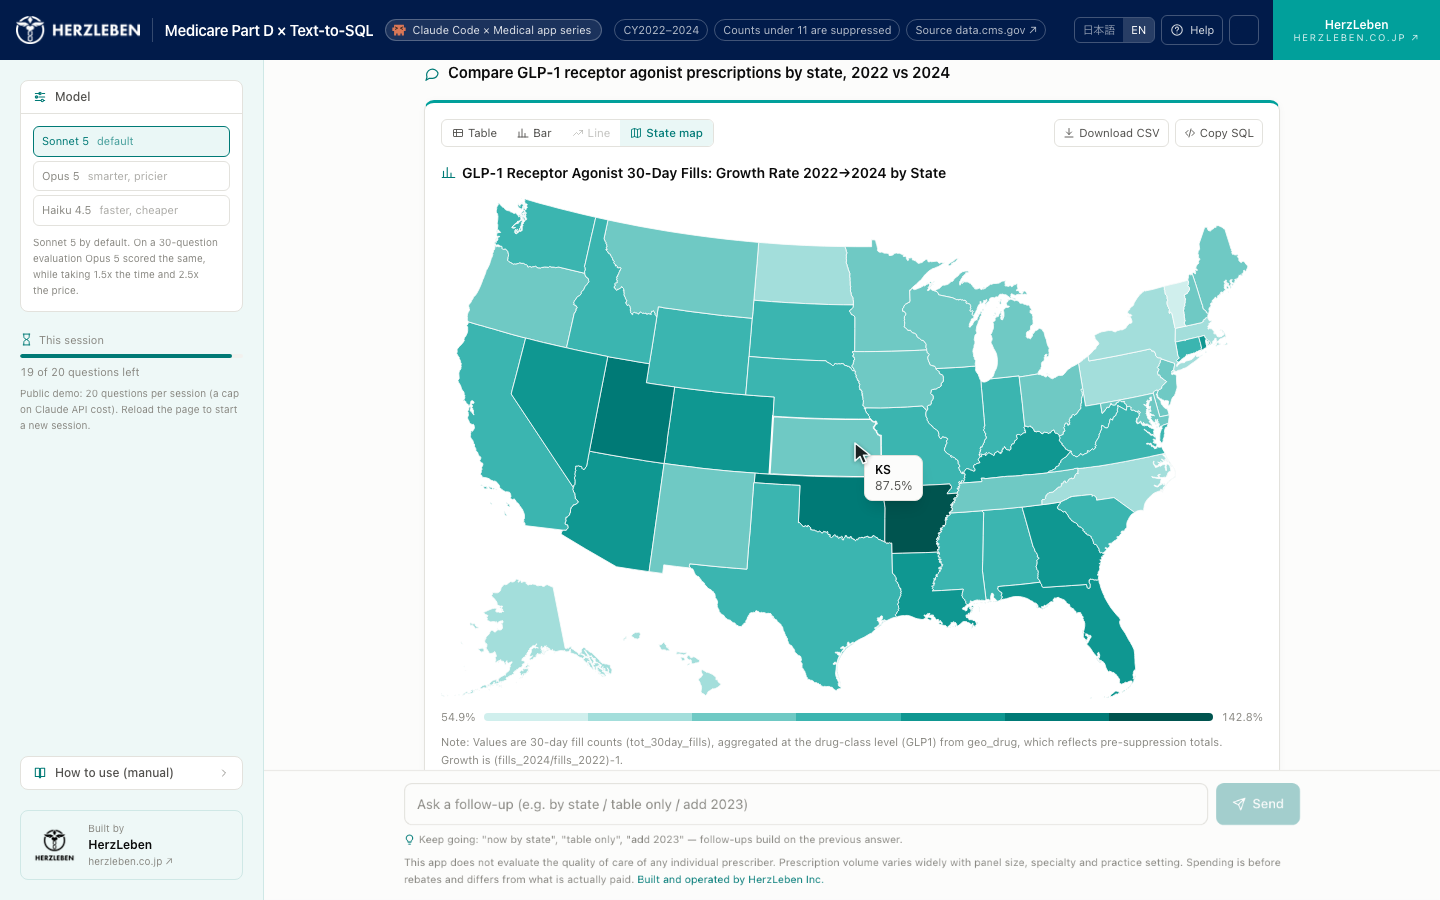
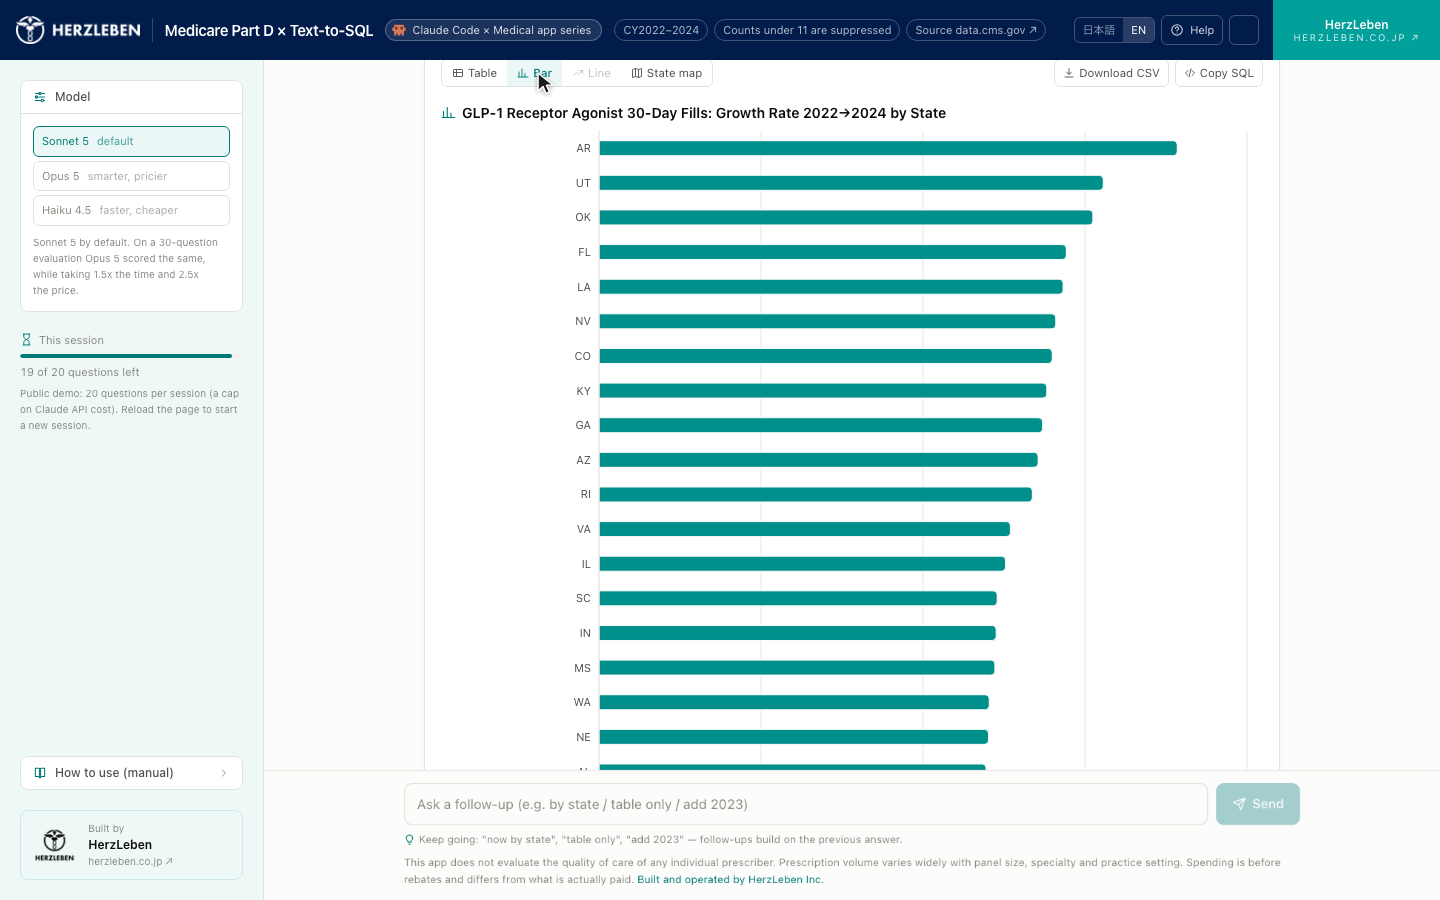
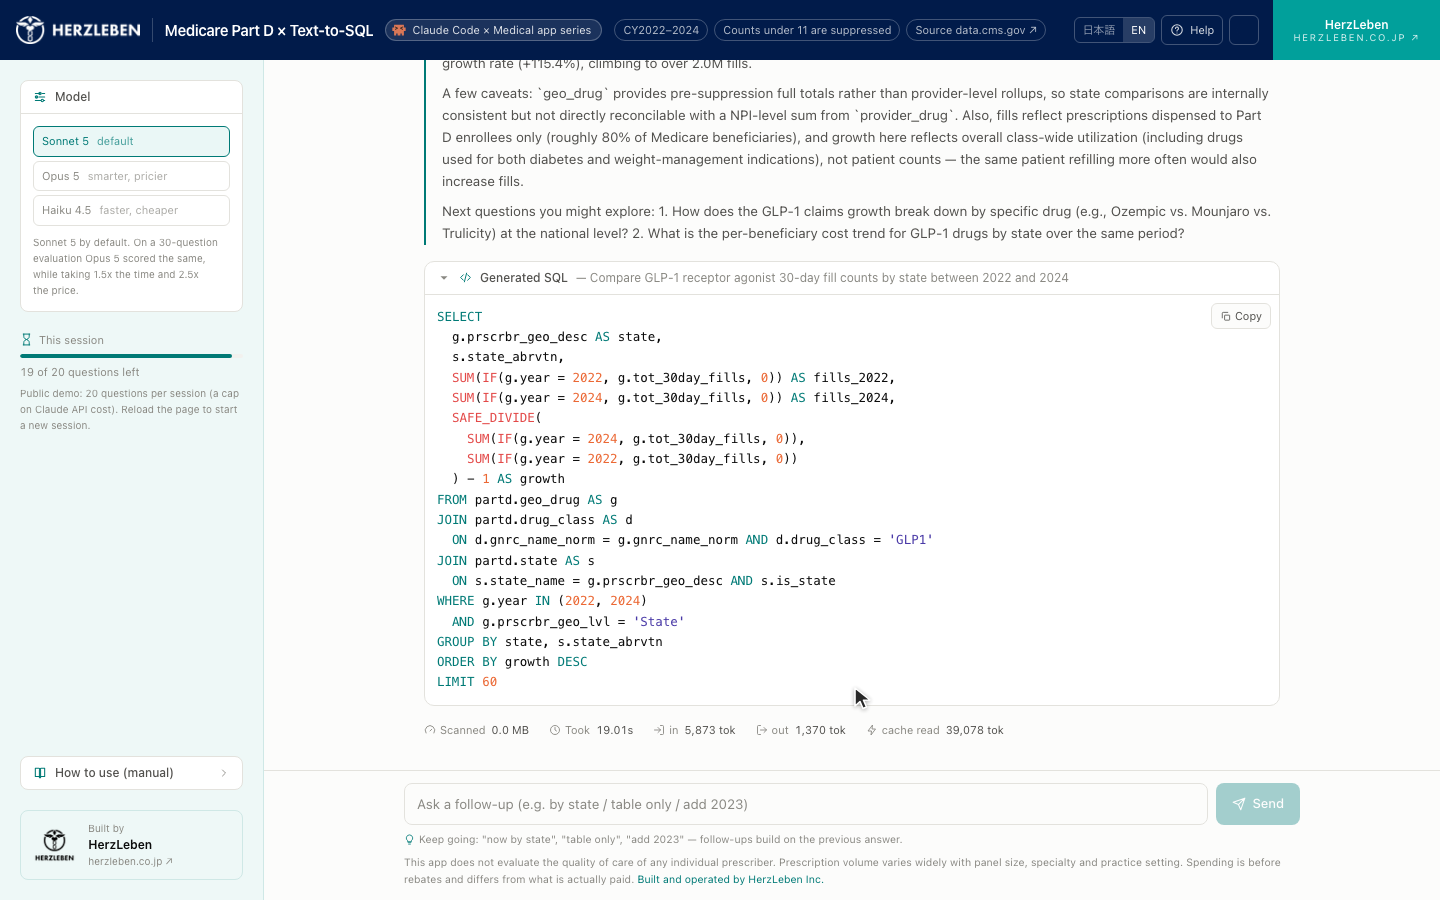
- Enter a question in Japanese (or English), and Claude generates BigQuery SQL, runs it, and returns the results as a table and a chart
- Claude picks the chart type (bar, line, state map, table) based on the results. One button switches between table, bar, and map — the SQL is not re-run
- Claude adds a three-to-five-sentence interpretation of the results and suggests two good follow-up questions
- The generated SQL is always available in a collapsible panel and can be copied
- Filters for year, state, specialty, and therapeutic class let you narrow the scope before asking
- The number of rows missing due to the under-11 suppression rule is shown alongside the aggregated results
3-2. Technical architecture
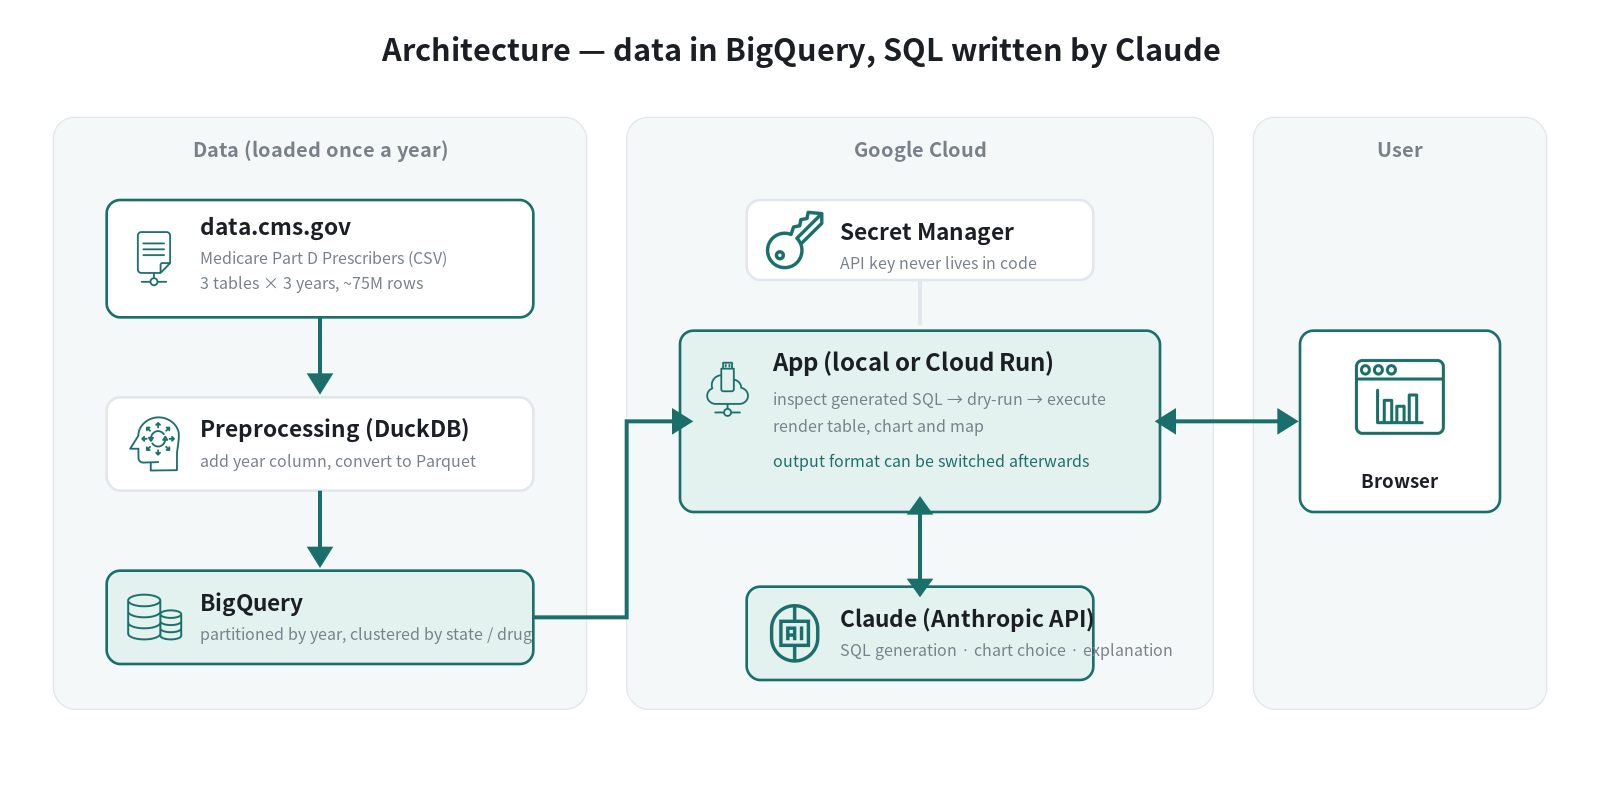
| Role | What we use | Why we chose it |
|---|---|---|
| Data storage and aggregation | BigQuery | Load a CSV and you can query it immediately. Aggregations over 25 million rows return in seconds |
| Running the app | Local, or Cloud Run | Running locally is the default. Cloud Run is only for those who want to publish (Part 4) |
| SQL generation and interpretation | Claude (Anthropic API) | With tool use, “run SQL” and “visualization spec” are separate tools, so the app can inspect the generated SQL before executing it |
| Development | Claude Code | Hand it a design document and a data dictionary, then work through everything from data loading to deployment conversationally |
3-3. On building with Claude Code
The other main theme of this series is: how much can you hand off to Claude Code?
📷 Screenshot planned: the Claude Code screen, right after the first prompt is submitted and the file list is being generated. Caption: “What I handed over wasn’t code — it was three documents: CLAUDE.md, a design document, and a data dictionary”
The initial instruction was just this.
CLAUDE.md と docs/ 配下を読んでから始めてください。フェーズ1「データ」から着手します。
まず CY2024 の Geography and Drug(最小ファイル)だけで疎通確認してから、残りのファイル・年に広げてください。
外部に影響するコマンドは実行前に見せてください。詰まった点は docs/DEPLOY.md に日付付きで残してください。
From there, I worked through six phases with Claude Code: data loading → prompt design → agent implementation → UI → accuracy evaluation → publication. Part 2 onward describes where I delegated and where a human made the call, with actual screenshots.
3-4. Distribution — the app is on GitHub, you run it in your own environment
Rather than hosting this app ourselves, we’re publishing the full codebase on GitHub for readers to run in their own environments. You use your own Claude API key.
- What you need: an Anthropic API key, a Google Cloud project, and Python
- Cloud Run isn’t needed if you just run it locally. Part 4 is written as a guide for those who want to publish to their own GCP
- The license is MIT. Part 2 covers what to watch out for when swapping in your own internal data
4. Summary
- The US publishes prescription data for free at prescriber × drug granularity, with physician names attached; Japan has no public data at this granularity
- When embedding generative AI in data analysis, it’s faster to settle the design (prompts, guardrails, accuracy measurement) on public data first
- This series shows the entire process of building an app by handing design documents to Claude Code, and publishes the code on GitHub. You run it in your own environment (with your own API key)
Next steps
Next we’ll dig into the data itself. Drawing on the official CMS data dictionary, we’ll cover how Medicare and Part D work, the structure of the three tables, the key columns, the suppression rules, and what this data can’t tell you.
Sources
- CMS, Medicare Part D Prescribers (data.cms.gov)
- CMS, Medicare Part D Prescribers Datasets: A Methodological Overview
- Ministry of Health, Labour and Welfare, NDB Open Data
The code is available on GitHub: github.com/HerzLeben/medicare-partd-text-to-sql