
Claude Code × Medical Application
[Explainer] What Is Text-to-SQL? — From a Question in Japanese to SQL to an Answer in Whatever Format You Want
1. What this page is for
This is the methods reference page for the series “Medicare Part D × Text-to-SQL.” It answers questions like “What is Text-to-SQL?”, “Is it safe to run AI-generated SQL as-is?”, and “Who decides what kind of chart to draw?” For background on the data itself, see “What is Medicare Part D.”
2. What Text-to-SQL is
Text-to-SQL turns a question written in plain language into SQL you can run against a database. Write “Compare state-level prescription counts for GLP-1 receptor agonists between 2022 and 2024,” and SQL like the following gets generated, executed, and returned as results.
SELECT prscrbr_geo_desc AS state,
       SUM(IF(year = 2022, tot_30day_fills, 0)) AS fills_2022,
       SUM(IF(year = 2024, tot_30day_fills, 0)) AS fills_2024
FROM partd.geo_drug
WHERE prscrbr_geo_lvl = 'State'
  AND gnrc_name IN ('Semaglutide', 'Dulaglutide', 'Liraglutide', 'Tirzepatide')
  AND year IN (2022, 2024)
GROUP BY state
ORDER BY fills_2024 DESC
Research on this goes back more than 20 years, but it has only become practical in the last few years. The reason is that large language models (LLMs) can now read table definitions and write SQL that fits the context. The big shift is that they can handle translations that require domain knowledge, such as expanding “GLP-1 receptor agonists” into the corresponding set of drug names.
3. How it works — six steps
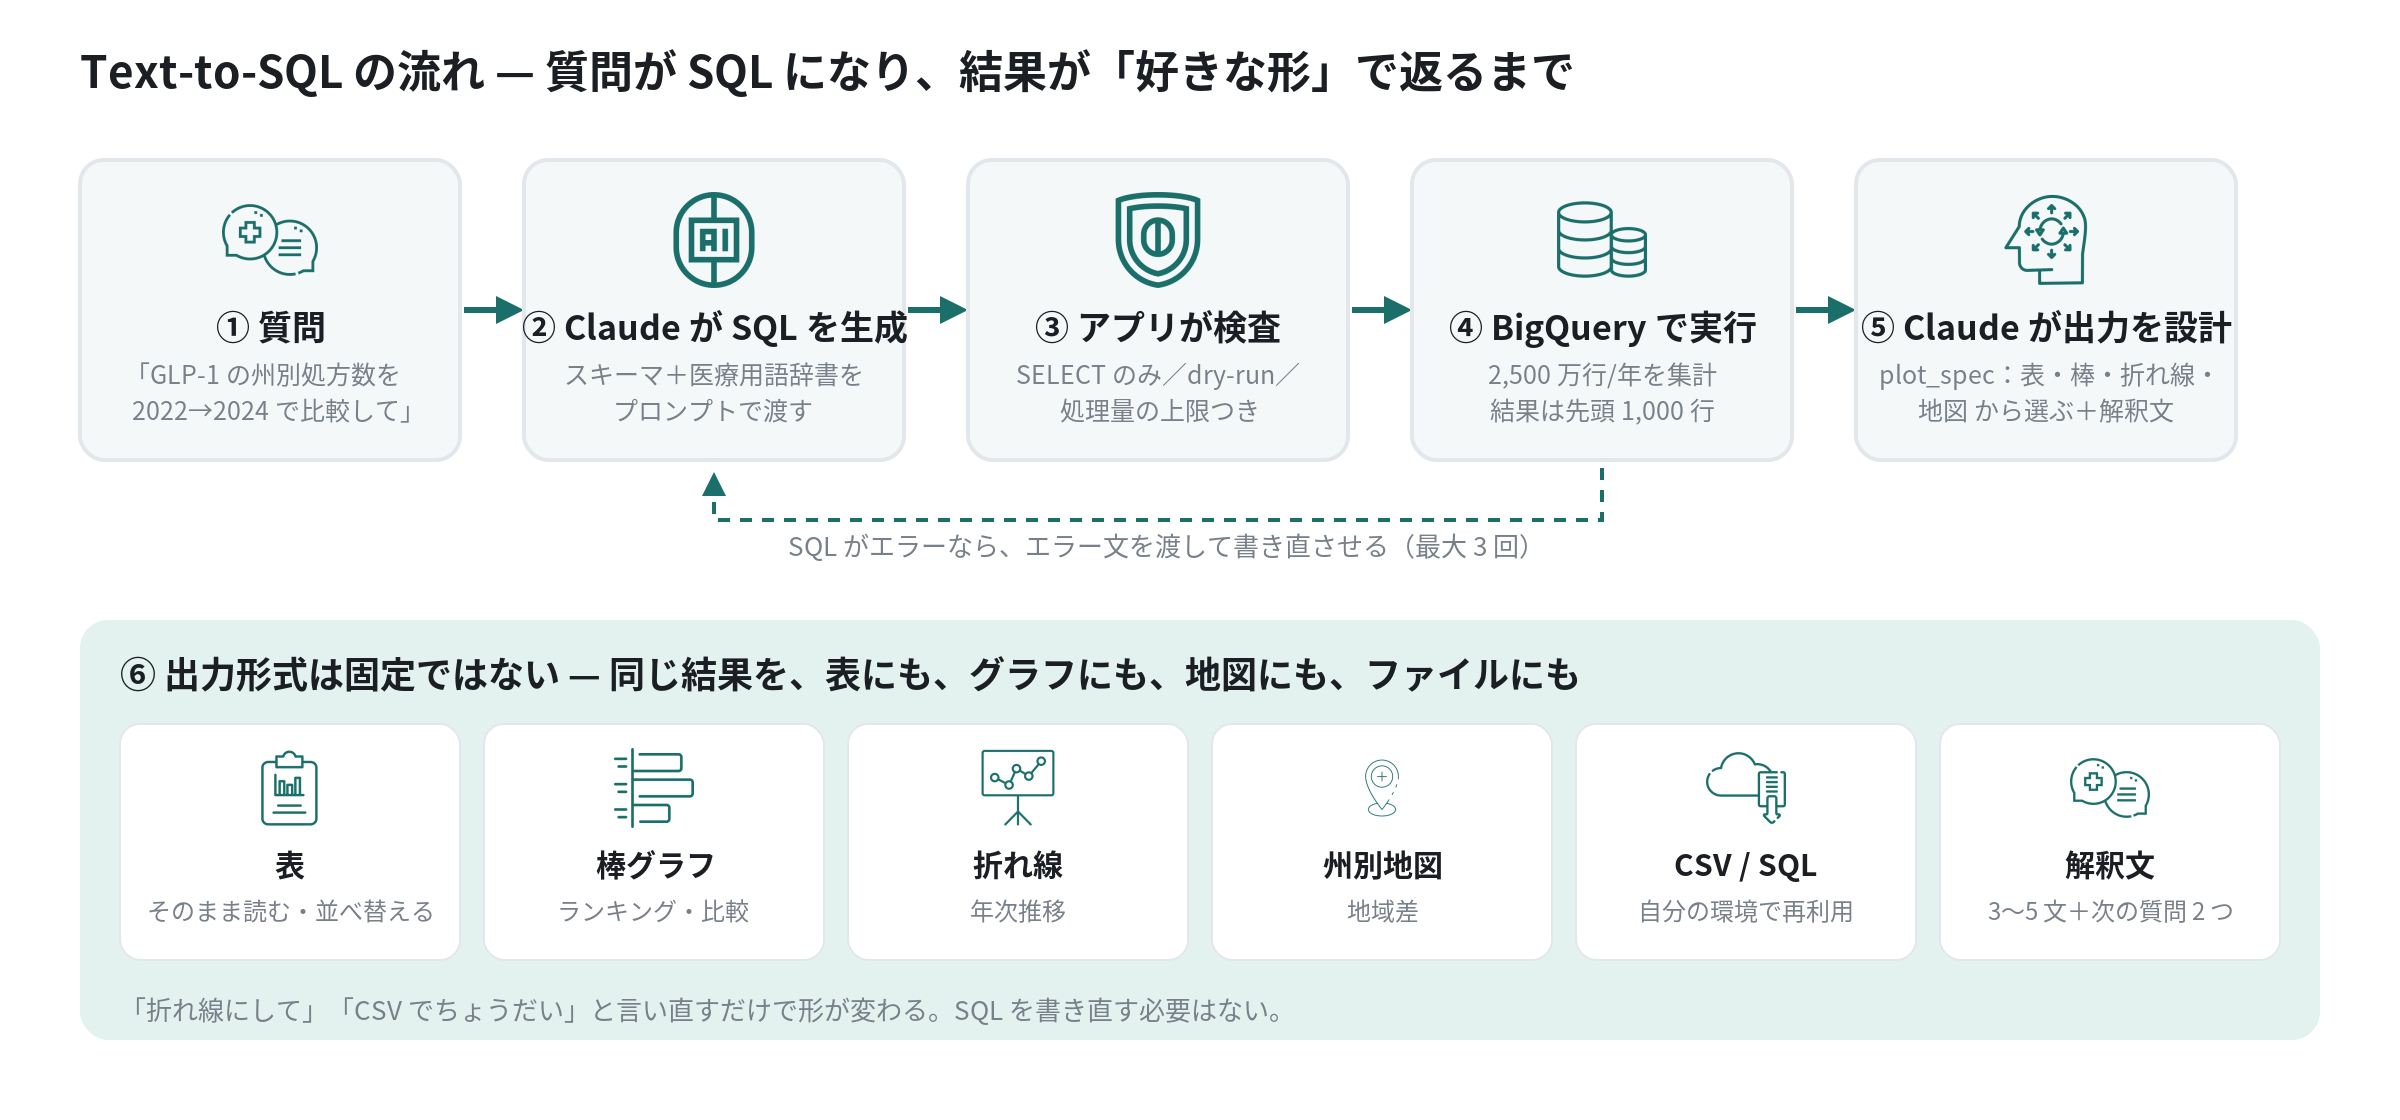
3-1. The question
The user writes a question in Japanese (or English). The app also lets you narrow the scope up front with filters for year, state, specialty, and drug class. Those filters are passed to Claude as part of the question text.
3-2. Claude generates SQL
Claude receives more than just the question. The system prompt carries three additional things.
| What we pass | Contents | Purpose |
|---|---|---|
| Schema | Column names, types, and meanings for the three tables | Prevents the model from using columns that don’t exist |
| Medical terminology dictionary | “Prescription count” → tot_30day_fills; “GLP-1” → four drug names; “psychiatry” → three variant spellings in Prscrbr_Type; and so on | Translates industry phrasing into columns and values |
| Few-shot examples | Five pairs of question and correct SQL | Demonstrates aggregation conventions (how to handle suppression, how to write year-over-year comparisons) |
This prompt is identical every time, so we use the Anthropic API’s prompt caching to avoid re-reading it after the first call.
3-3. The app inspects the SQL
The generated SQL is not executed as-is. Before running it, the app checks it mechanically.
- Only statements beginning with
SELECTorWITHpass. Anything containingDELETE,UPDATE,DROP, etc. is rejected - Any reference to a dataset other than
partd.is rejected SELECT *returns an error and forces a rewrite (columns must be listed explicitly)- A BigQuery dry run estimates bytes processed; queries above the limit are not executed
These checks run in code, not in the LLM. “Don’t rely on the AI for safety” is a founding principle of the design.
3-4. Run on BigQuery, self-correct on failure
SQL that passes inspection is executed on BigQuery. If it fails on a bad column name or a type error, we hand the error message straight back to Claude and have it rewrite the query (up to three times). This simply automates the trial and error a human goes through when writing SQL.
3-5. Claude designs the output
Given the result table (first 1,000 rows), Claude returns two things:
- plot_spec: the chart type (table, bar, line, state-level map), which columns go on the x and y axes, and which column drives color
- Interpretation: three to five sentences of readout, plus two good follow-up questions
Claude picks the chart type because it can judge from the shape of the results — a list of states suggests a map, a list of years suggests a line chart.
3-6. The output format is not fixed
This is the most commonly misunderstood point about Text-to-SQL. The form of the output is decided independently of the SQL. The same result set can be a table, a bar chart, a line chart, a map, or a CSV.
Users just say “make it a line chart,” “show it on a map,” or “give me a CSV,” and the form changes. The SQL doesn’t need to be rewritten; only the plot_spec changes. Conversely, say “same format, but add 2023,” and this time only the SQL changes.
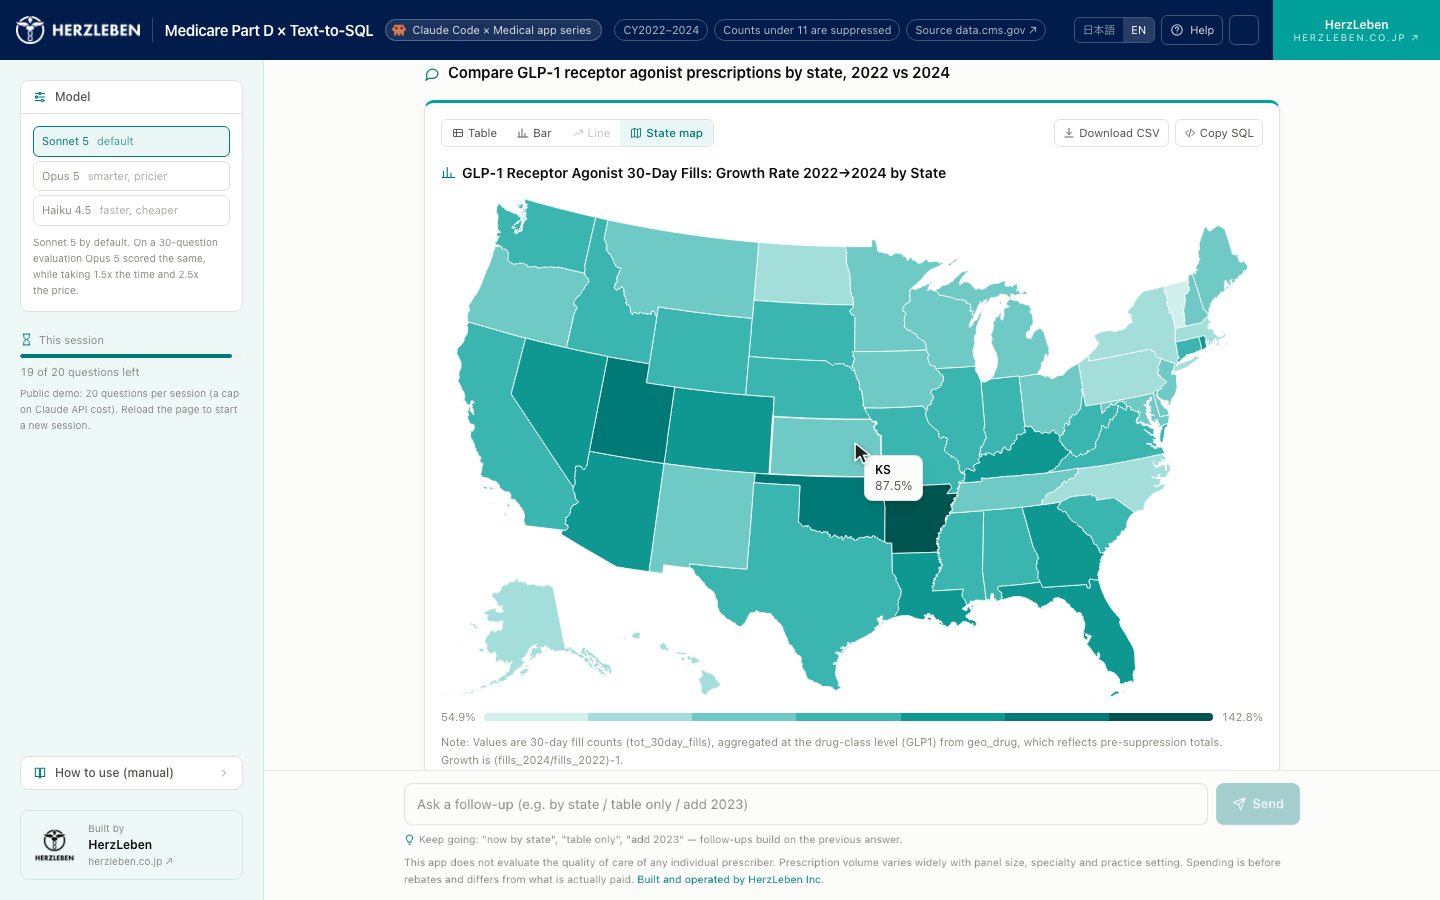
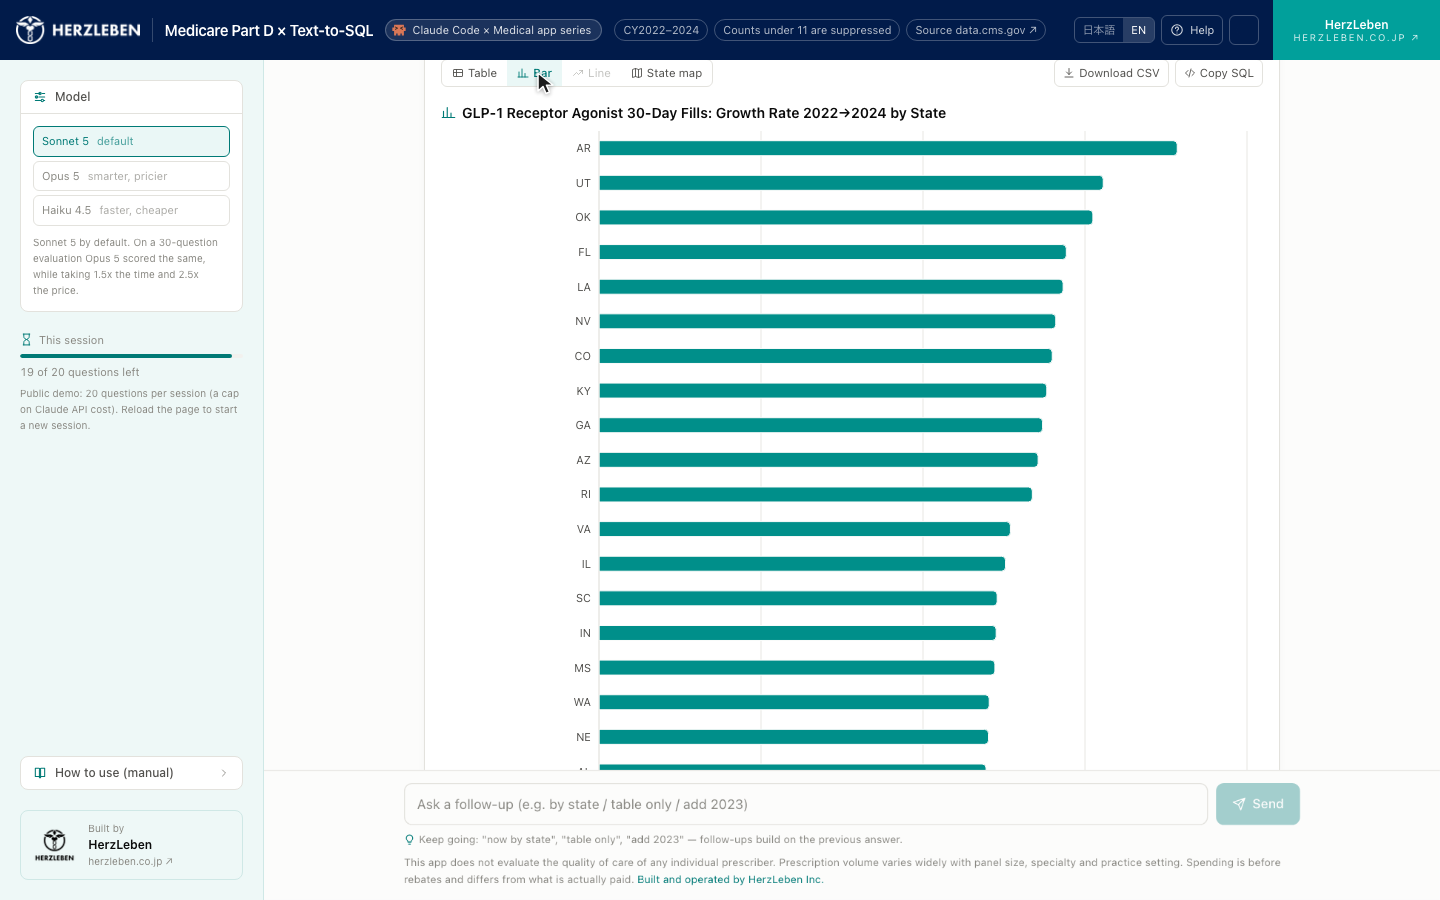
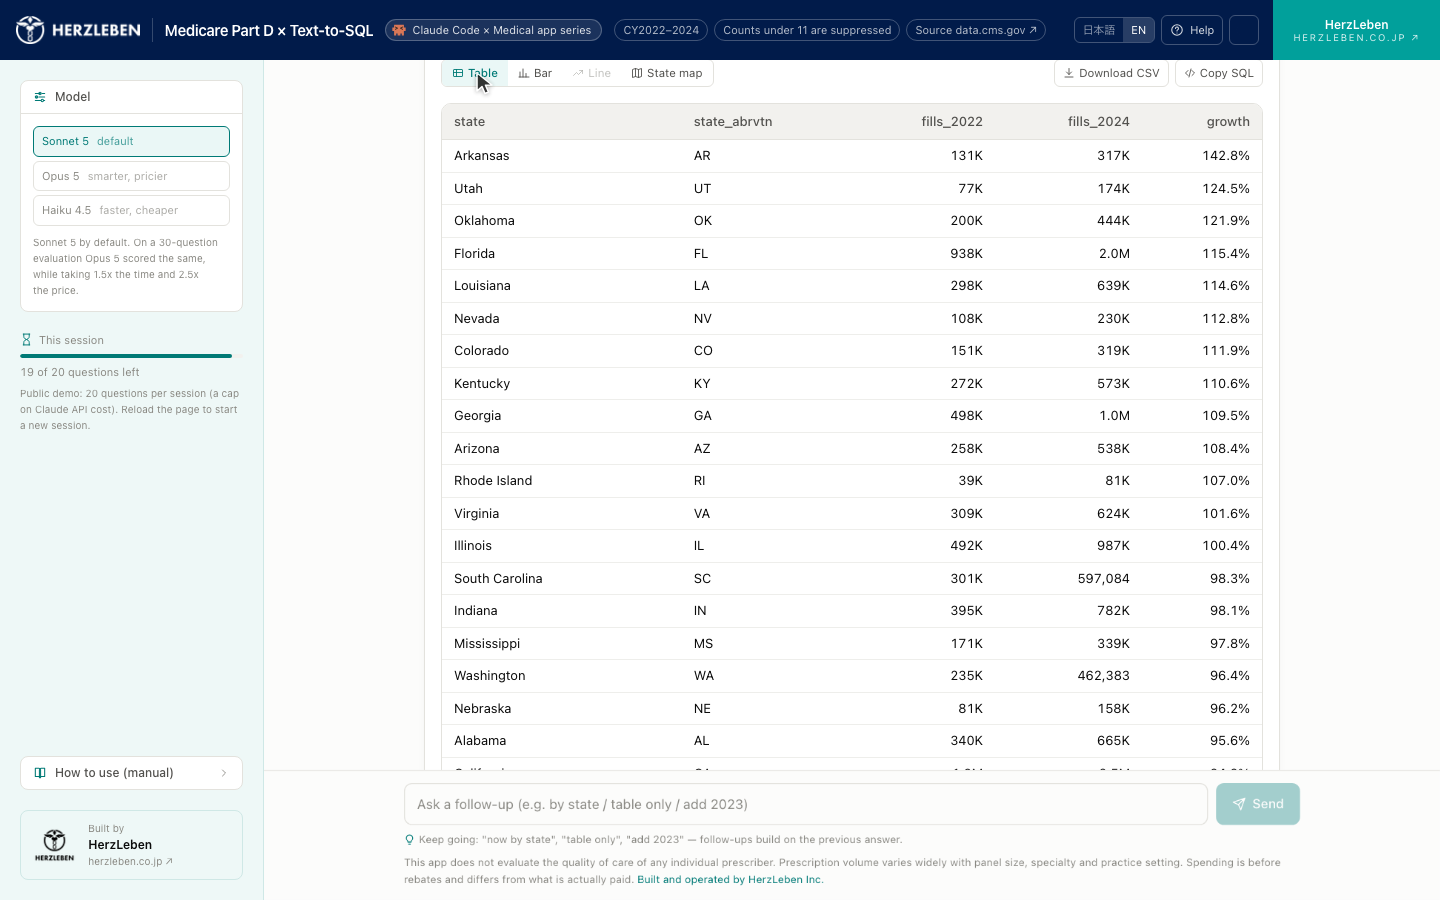
In this series’ app, the generated SQL itself is also shown in a collapsible panel and can be copied. That, too, is “one of the outputs.” Take the SQL with you and you can reproduce the same aggregation in your own BigQuery, or against another database inside your organization.
4. tool use — separate tools for “run SQL” and “chart spec”
The key to implementing the flow above is Claude’s tool use. Tell Claude “you can call this function,” and it replies with a function call (JSON) instead of prose. This series’ app defines only two.
{
  "name": "run_sql",
  "description": "Run a read-only BigQuery SQL and return up to 1000 rows",
  "input_schema": {
    "type": "object",
    "properties": { "sql": { "type": "string" } },
    "required": ["sql"]
  }
}
{
"name": "plot_spec",
"description": "Describe how to visualize the last result",
"input_schema": {
"type": "object",
"properties": {
"kind": { "enum": ["table", "bar", "line", "choropleth_state"] },
"x": { "type": "string" },
"y": { "type": "string" },
"color": { "type": "string" }
},
"required": ["kind"]
}
}We split this into two tools so that the app can intervene before any SQL runs. The order is: Claude calls run_sql → the app inspects and executes it → results go back to Claude → Claude calls plot_spec. Claude never touches the database directly.
5. How to measure accuracy
With Text-to-SQL, “it runs” and “it’s correct” are two different things. SQL can execute without error and still aggregate the wrong thing. For this series we built a 30-question evaluation set and grade on three levels.
| Grade | Meaning |
|---|---|
| Executes | The SQL ran without error |
| Results match | Matches the results of human-written reference SQL (ignoring ordering and rounding) |
| Interpretation is sound | The interpretation text doesn’t contradict the results |
Three failure modes come up repeatedly: confusing claim counts (tot_clms) with prescription volume (tot_30day_fills), computing “totals” that ignore rows missing due to suppression, and missing records because of specialty naming variants. All three can be eliminated with the terminology dictionary and few-shot examples. Measured accuracy figures will be published in Part 3.
6. Considerations when extending this to internal data
The prompts, guardrails, and evaluation method we hardened on public data carry over directly to internal data. But three things need to be settled first.
- Which tables to expose: Claude only knows the tables you put in the schema. Conversely, anything you put in is fair game for questions
- Who executes: BigQuery execution permissions attach to the app’s service account. If you need per-user row-level control, that requires a separate design
- Where logs go: Always record the question text, generated SQL, bytes processed, and elapsed time. You’ll use them for both auditing and accuracy improvement
7. Summary
- Text-to-SQL converts “question → SQL.” The LLM writes it by reading the schema and terminology dictionary
- Generated SQL is inspected in code before it runs. On failure, the error text goes back for self-correction
- The output form (table, chart, map, CSV, interpretation) is decided independently of the SQL. Just rephrase to change it
- “It runs” and “it’s correct” are different. Measure with an evaluation set
Next steps
Part 2 of the main series walks through implementing this mechanism with Claude Code, showing the actual terminology dictionary and tool definitions.
Sources
- Anthropic, Claude Developer Platform — Tool use / Prompt caching (docs.claude.com)
- Google Cloud, BigQuery — Dry run queries / maximum_bytes_billed
- CMS, Medicare Part D Prescribers Data Dictionary (data.cms.gov)
The code is available on GitHub: github.com/HerzLeben/medicare-partd-text-to-sql