
Claude Code × Medical Application
[Business Explainer] Lines of Therapy — How They Are Counted in Real-World Data and How to Read a Sankey Diagram
1. About this page
This is a reference page that explains the treatment line transitions covered in the series “Treatment Pathways on One Page,” kept separate from the main articles. It aims to answer, on one page, questions such as “What is a line of therapy?”, “Where is it looked at, and by whom?” and “What should I watch out for in a Sankey diagram?”
- No fixed definitioneach study sets its own rules for where the “next line” begins
- 5.7%the share of line assignments that changed just by changing the rules (a lung cancer study)
- About 40,000patientsthe size of a study that followed treatment switches in rheumatoid arthritis using Japanese hospital data
- 2waysthe base for the percentages in a Sankey diagram (everyone, or the patients who reached that line)
All the figures and screenshots on this page were produced with fictitious rheumatoid arthritis data. They are not related to any real patient, institution, drug or company.
2. What is a line of therapy?
2-1. Regimens and lines
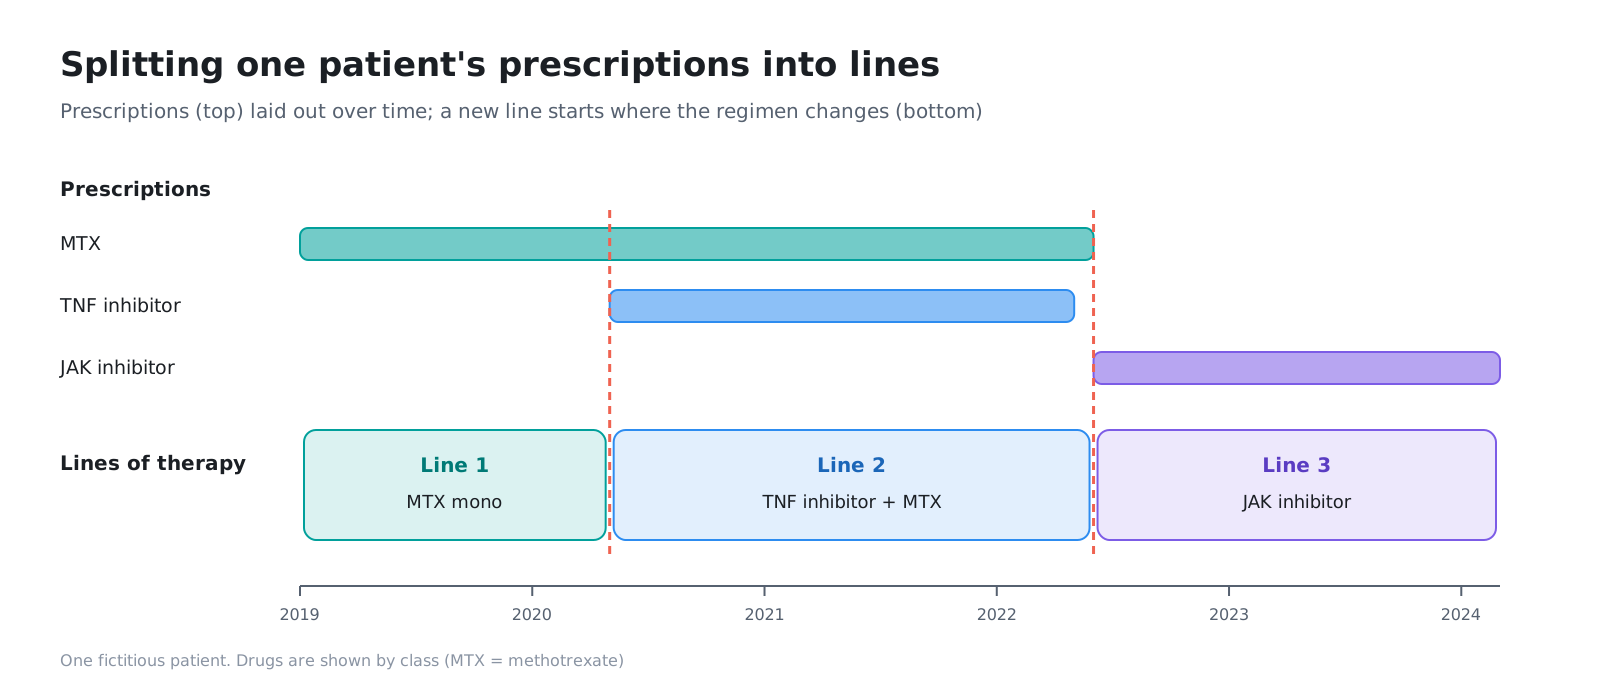
In drug treatment for chronic diseases and cancer, treatment is changed step by step, for reasons such as an insufficient effect or side effects. The first treatment is called first-line therapy, the next second-line therapy, and this order is called the line of therapy.
The combination of drugs used in one line is called a regimen. In rheumatoid arthritis, for example, “methotrexate (MTX) monotherapy” and “TNF inhibitor + MTX” are each one regimen.
2-2. Where does the “next line” begin?
Clinical records do not say “second-line therapy starts here.” Lines are divided from the prescription records by rules that someone sets. Typical situations where the decision is unclear include the following.
| Situation | Count it as the next line? |
|---|---|
| Switched to a drug of a new class | Usually the next line |
| Added another drug to the current one | Varies between studies |
| Stopped a drug (only one of a combination) | Varies between studies |
| Paused treatment for a while, then restarted the same drug | Depends on the length of the pause |
| Switched to another drug within the same class | Varies between studies |
| Switched soon after starting treatment | Sometimes treated as the same line |
In oncology, a method has been proposed that builds the rules around three axes: how a regimen is defined, adding and stopping drugs, and the length of treatment gaps (Hess et al. 2021). A lung cancer study proposed six rules, and compared with earlier rules, line assignments changed in 5.7% of cases (Grady et al. 2024). The authors caution that even a small difference can change conclusions in analyses such as comparing effects by line.
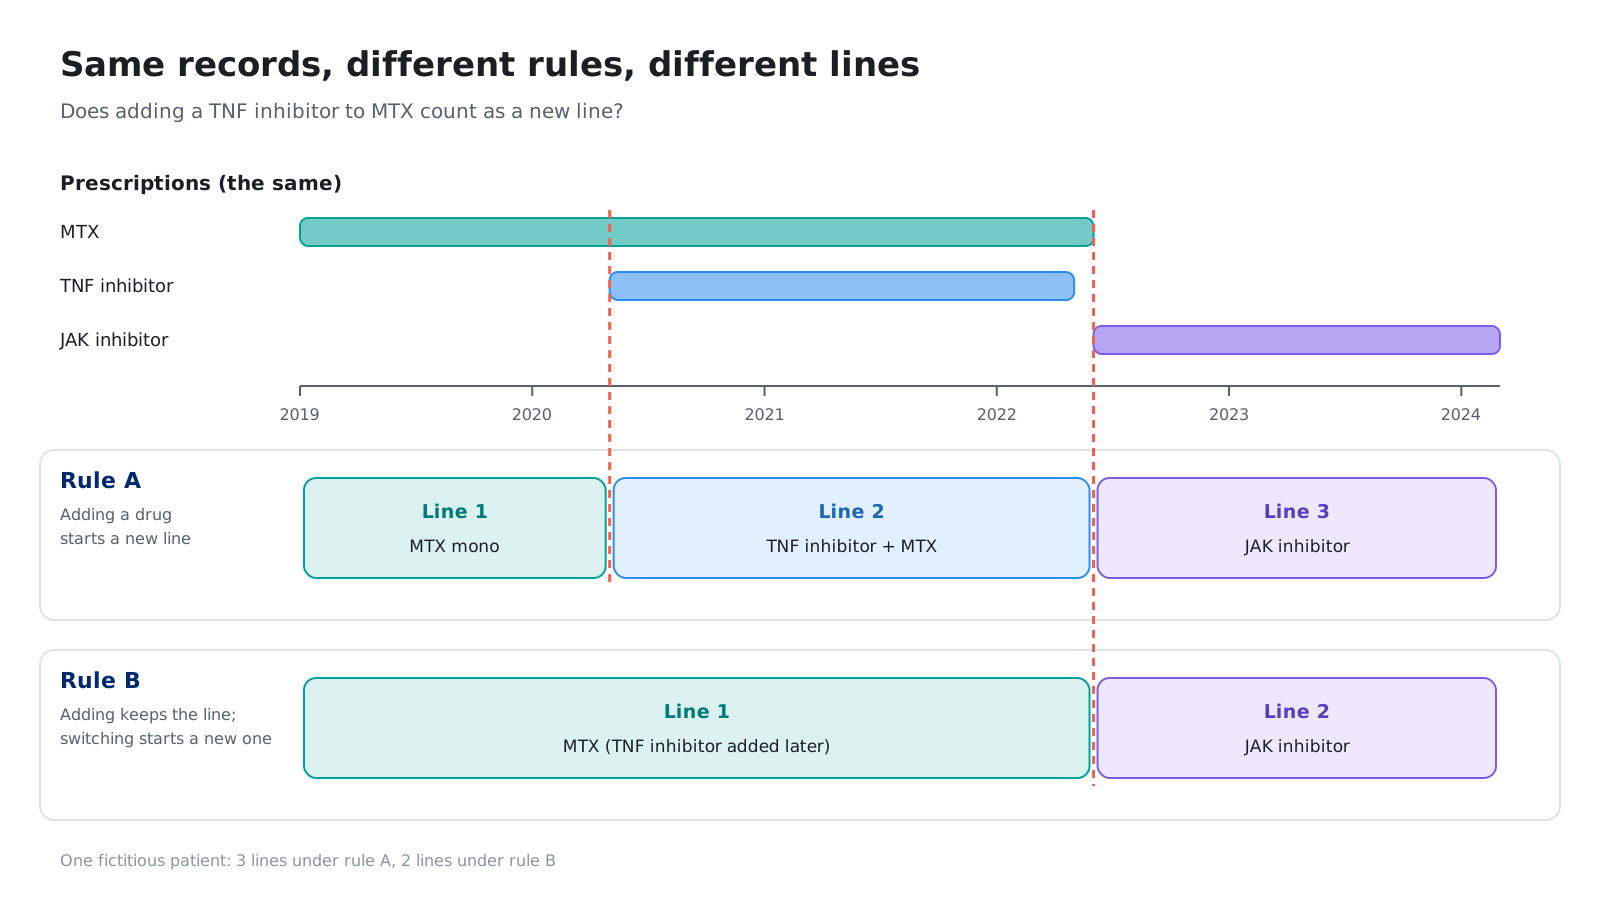
There is no fixed definition of a line of therapy. When looking at a chart, too, you need to know which rules were used to divide the lines.
3. Where treatment line transitions are used
3-1. Which data to use
Treatment pathways are viewed from data generated in routine clinical practice (real-world data, RWD). What you can and cannot see depends on the type of data.
| Data | What you can see | What is hard to see |
|---|---|---|
| Claims data (insurance claims) | Prescription dates and drugs, diagnoses, visits across medical institutions (for insurer data) | Test values, reasons for changing treatment |
| Hospital data (DPC, hospital claims) | Prescriptions and admissions at that hospital | Treatment at other medical institutions (transfers, first-line therapy given by a previous doctor) |
| Electronic medical records (EMR) | Test values, physicians’ notes | Records across institutions, differences in how each institution records things |
| Disease registries | Disease severity, reasons for changing treatment | Limited to participating institutions and patients |
For example, a study that followed about 40,000 patients with rheumatoid arthritis in Japanese hospital data showed that TNF inhibitors were the most common first-line biologic or JAK inhibitor therapy, and that most patients who switched moved to a different class (Miyashiro et al. 2024). At the same time, it noted that hospital data cannot see treatment started at other medical institutions, so first-line therapy may be undercounted.
As a cross-country example, a study within the international research framework OHDSI laid out treatment sequences for diabetes, hypertension and depression across many databases (Hripcsak et al. 2016).
3-2. Medical affairs — understanding actual treatment practice
- After approval, find out in which line your company’s drug is used and what patients switch from
- Show treatment pathways as figures for congress presentations and publications
- Answer healthcare professionals’ question “What is used after this drug?” with data
3-3. Marketing and sales planning — explaining treatment pathways
- Share within the company where your drug sits in the treatment pathway
- After a new drug launches, compare year by year how the pathways have changed
3-4. RWE and epidemiology — a first look before a study
- Before writing a study plan, count how many patients are in each line
- Before deciding how to divide lines, look at how the prescriptions are sequenced
- Check whether the treatment pairs you want to compare have enough patients in the data
3-5. HTA and market access — knowing the comparator
- In cost-effectiveness evaluation, a new drug is compared with “the treatment currently used.” Find out what is actually used in that line
3-6. Who reads it
| Reader | Role | If the chart is hard to read |
|---|---|---|
| Medical affairs staff | Summarise actual treatment practice and explain it inside and outside the company | They have to re-aggregate the data every time they explain it |
| RWE and epidemiology staff | Design studies and analyse data | The first look before setting definitions takes time |
| Marketing staff | Think about positioning within the treatment pathway | They cannot read the flow from the numbers in tables |
| Physicians and healthcare professionals | Read results at congresses and in papers | It is not clear which treatment patients moved from and to |
4. How to read a Sankey diagram
A chart commonly used to show treatment pathways on one page is the Sankey diagram. It shows the size of a flow by the width of a band. Applied to lines of therapy, it reads as follows.
- Vertical bars (nodes): the regimens in each line, arranged from left to right as first-line, second-line and so on
- Bands (ribbons): the patients who moved from a regimen in one line to a regimen in the next line
- Width: the number of those patients
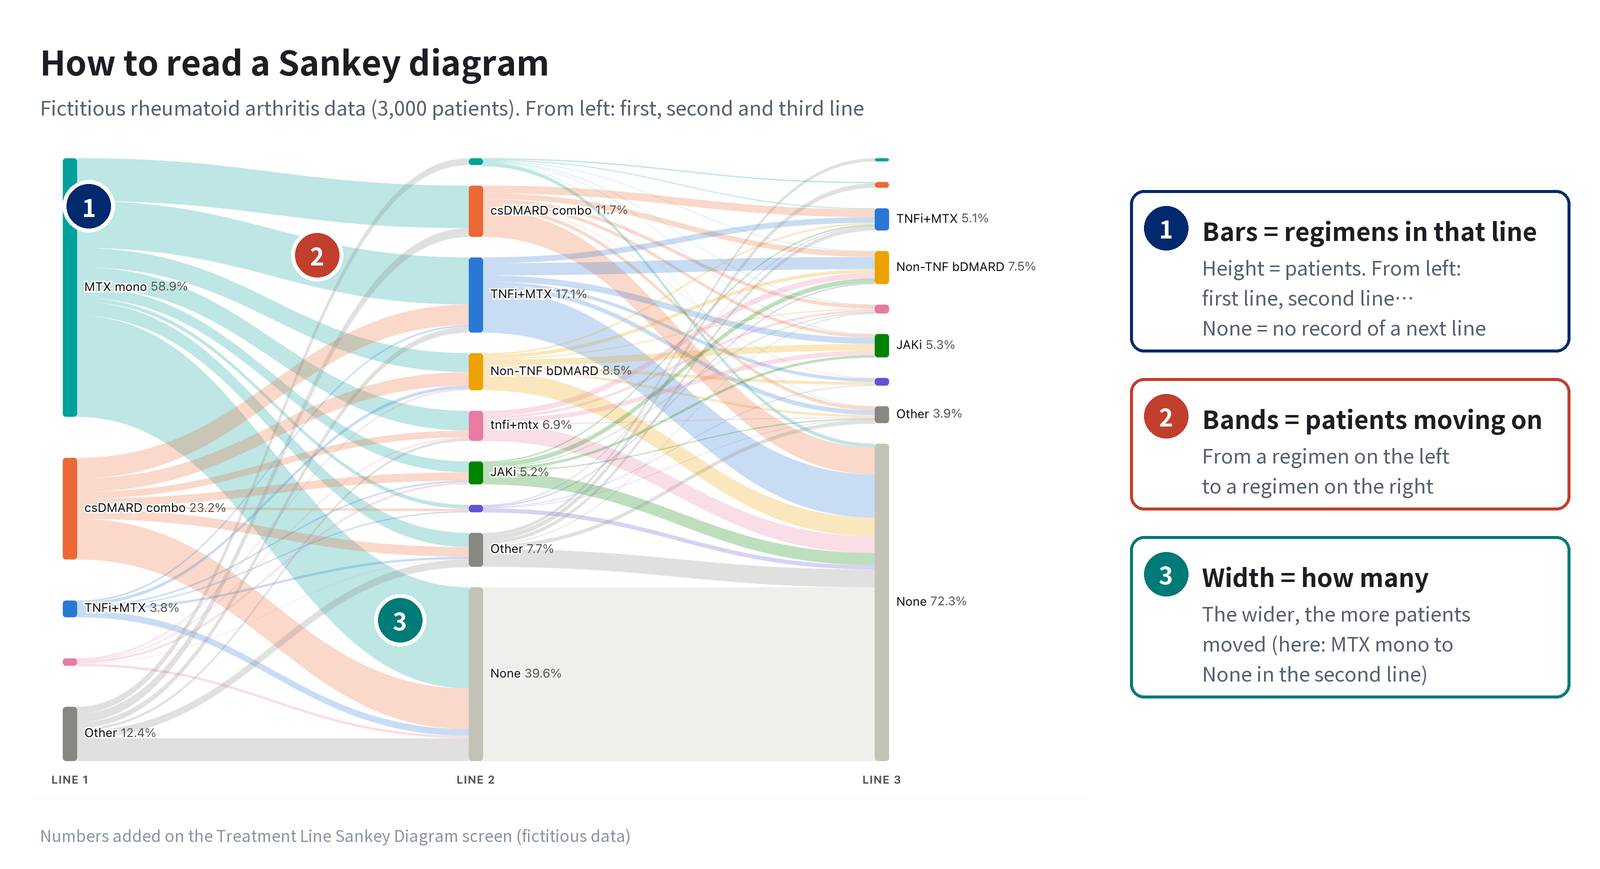
In a table, you would read row by row: “Of the patients whose first-line therapy was MTX monotherapy, X moved to TNF inhibitor + MTX in second-line therapy.” In the chart, you can see all of this at once from the widths of the bands.
5. Pitfalls
A Sankey diagram shows flows at a glance, but its impression can change a great deal depending on how it is drawn. When reading or drawing one, watch out for the following five points.
5-1. The base — “what percentage of how many?”
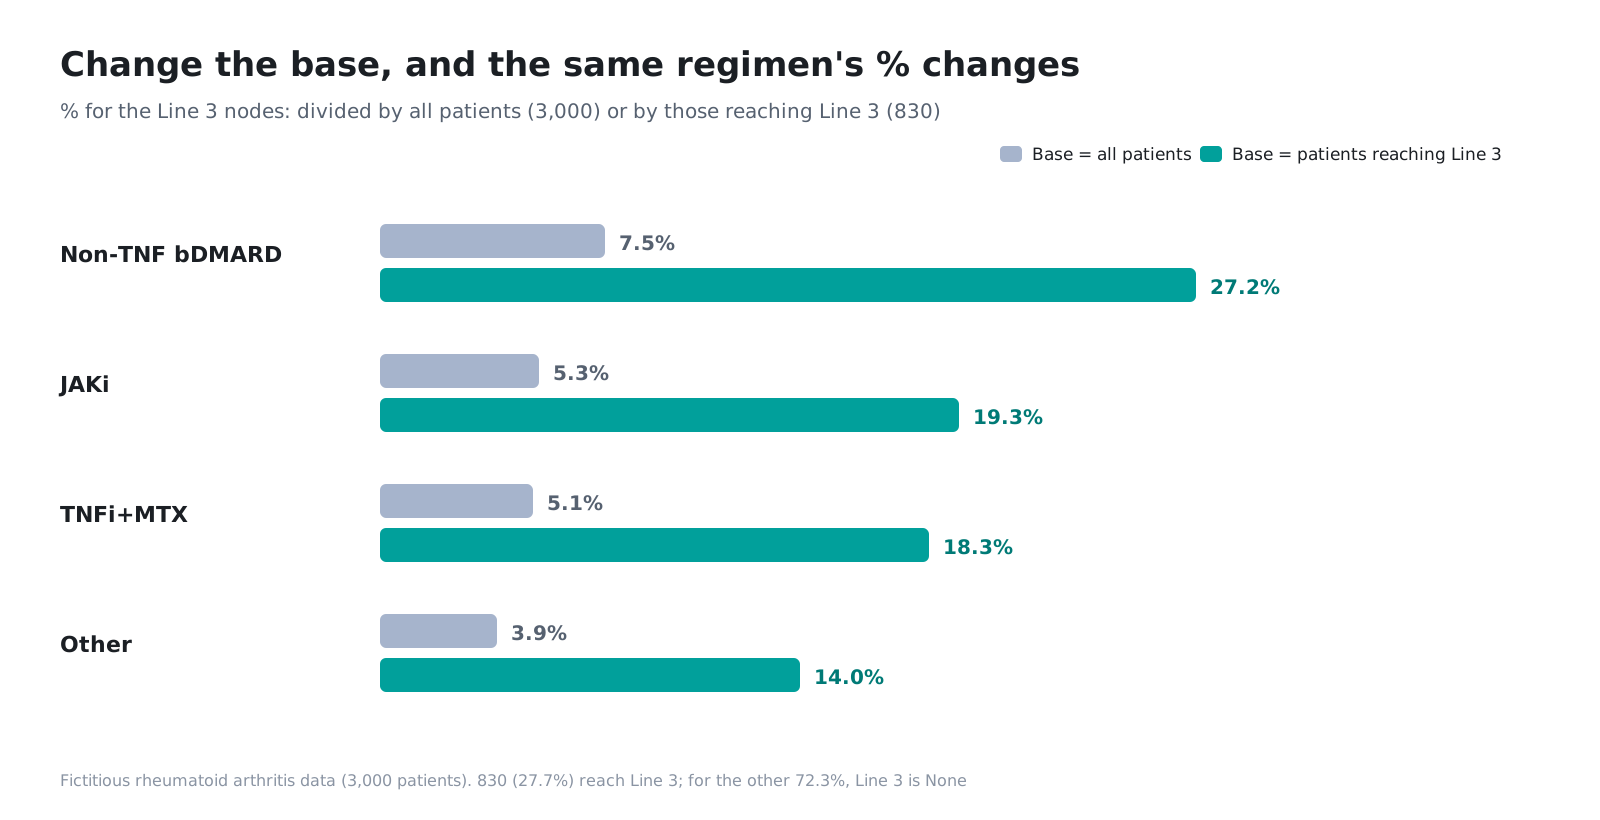
When a percentage is added to a band, the number changes depending on whether the base is “everyone who started first-line therapy” or “the patients who reached that line.” The third-line bars look small with everyone as the base, and large with the patients who reached that line as the base.
5-2. Grouping into Other — where to draw the line
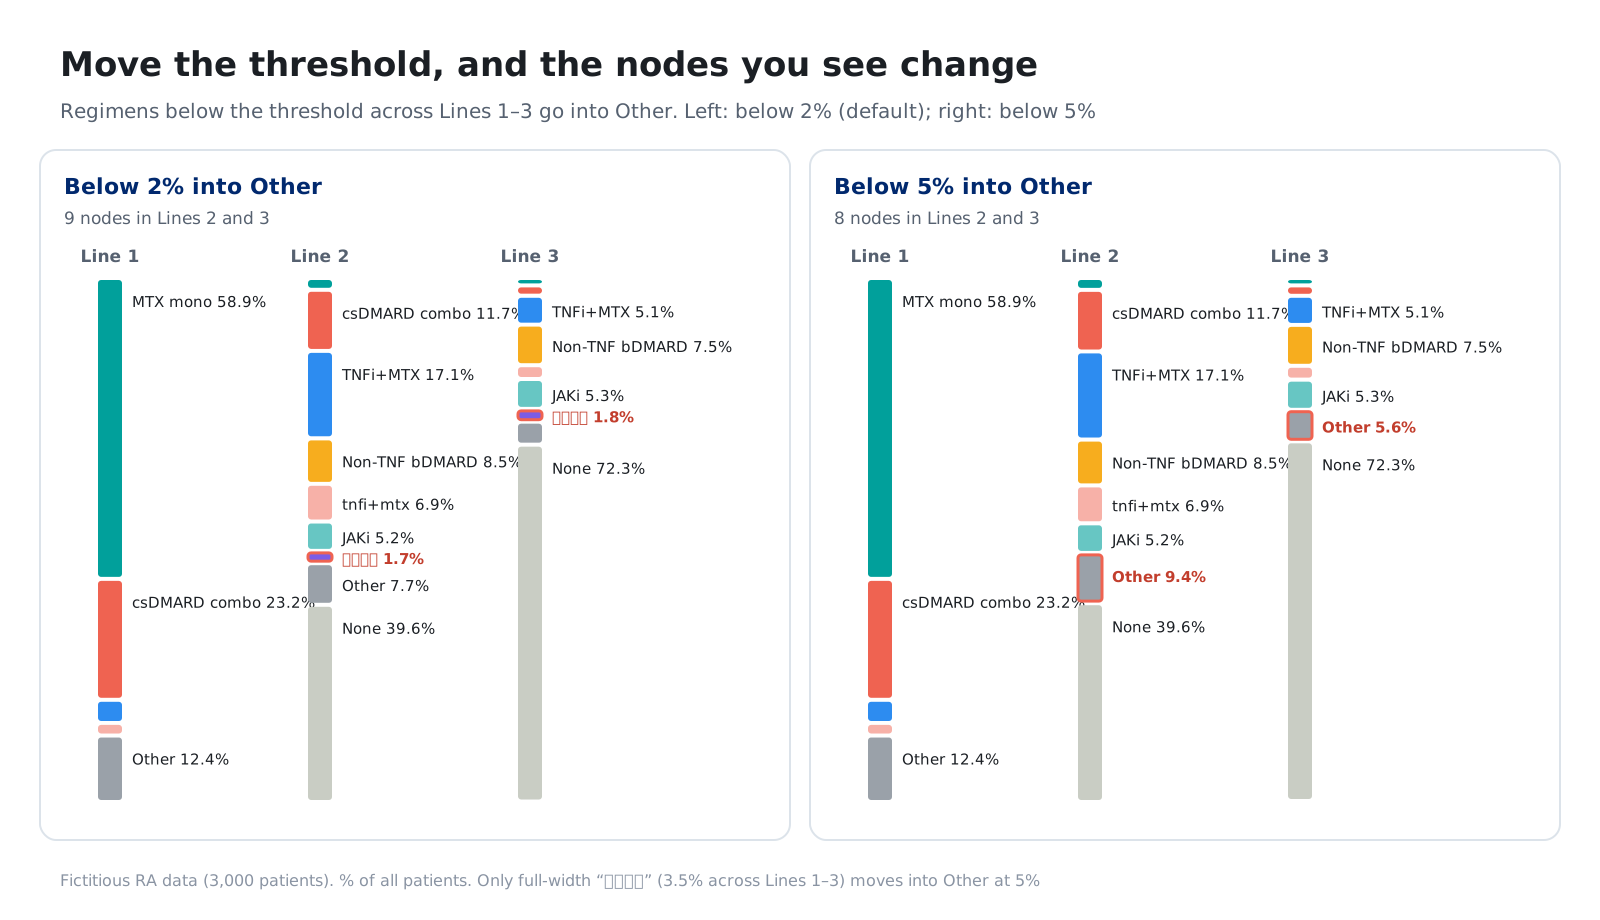
If every rare regimen gets its own bar, thin bands multiply and the chart becomes unreadable. So a line is drawn, such as “group anything below 2% of the total into Other,” but where the line is drawn changes the impression of the chart. When you are interested in less common treatments, you need to lower the line and look again.
5-3. What it means when there is no next band — still on treatment, or lost to follow-up?
Patients with no band beyond second-line therapy may still be on second-line therapy, or they may simply have become impossible to follow because of a transfer or the end of the data period. The chart alone cannot tell these apart. You need to look at how long the follow-up period was alongside the chart.
5-4. A band only remembers “one step back”
A band from second to third line does not distinguish what the patient used in first-line therapy. A study of treatment sequences in rheumatoid arthritis using a US registry also points out that a Sankey diagram shows transitions between lines but not the whole pathway up to that point (Matsson et al. 2024). To find out “third-line therapy for patients who used A in first line and B in second line,” you need to narrow down to that group and redraw the chart.
5-5. Name variants — the same treatment splits into separate bars
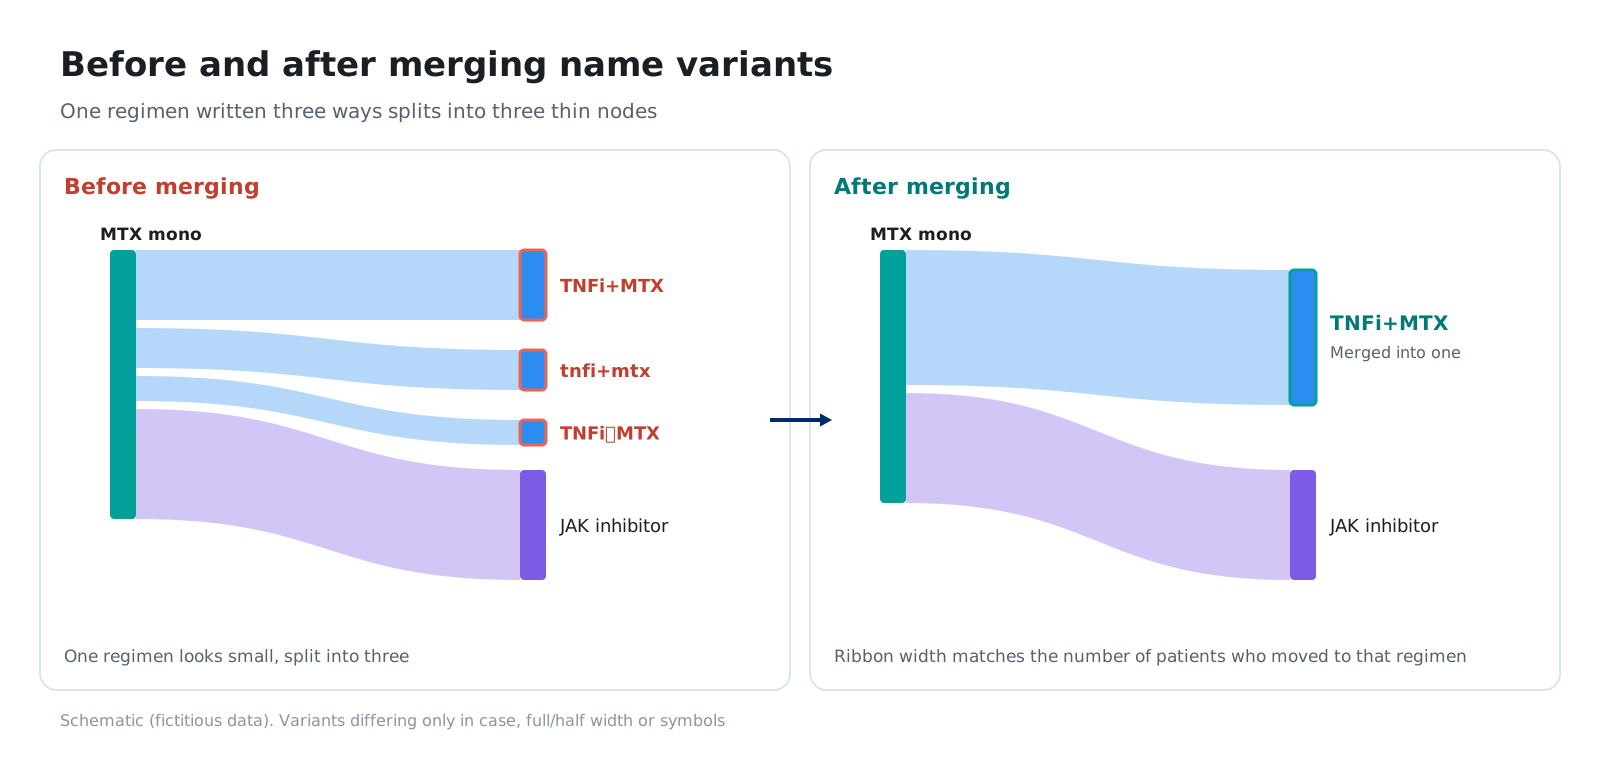
Depending on the institution or data source, the same regimen may be entered in different ways, such as “TNFi+MTX”, “tnfi+mtx” and “TNFi+MTX”. If the data are charted as they are, the same treatment splits into separate bars and the bands look thinner. The names need to be made consistent before charting.
6. Today’s approach and its limits
6-1. Summary tables and hand-made charts
Treatment line transitions are usually viewed through a process like the following.
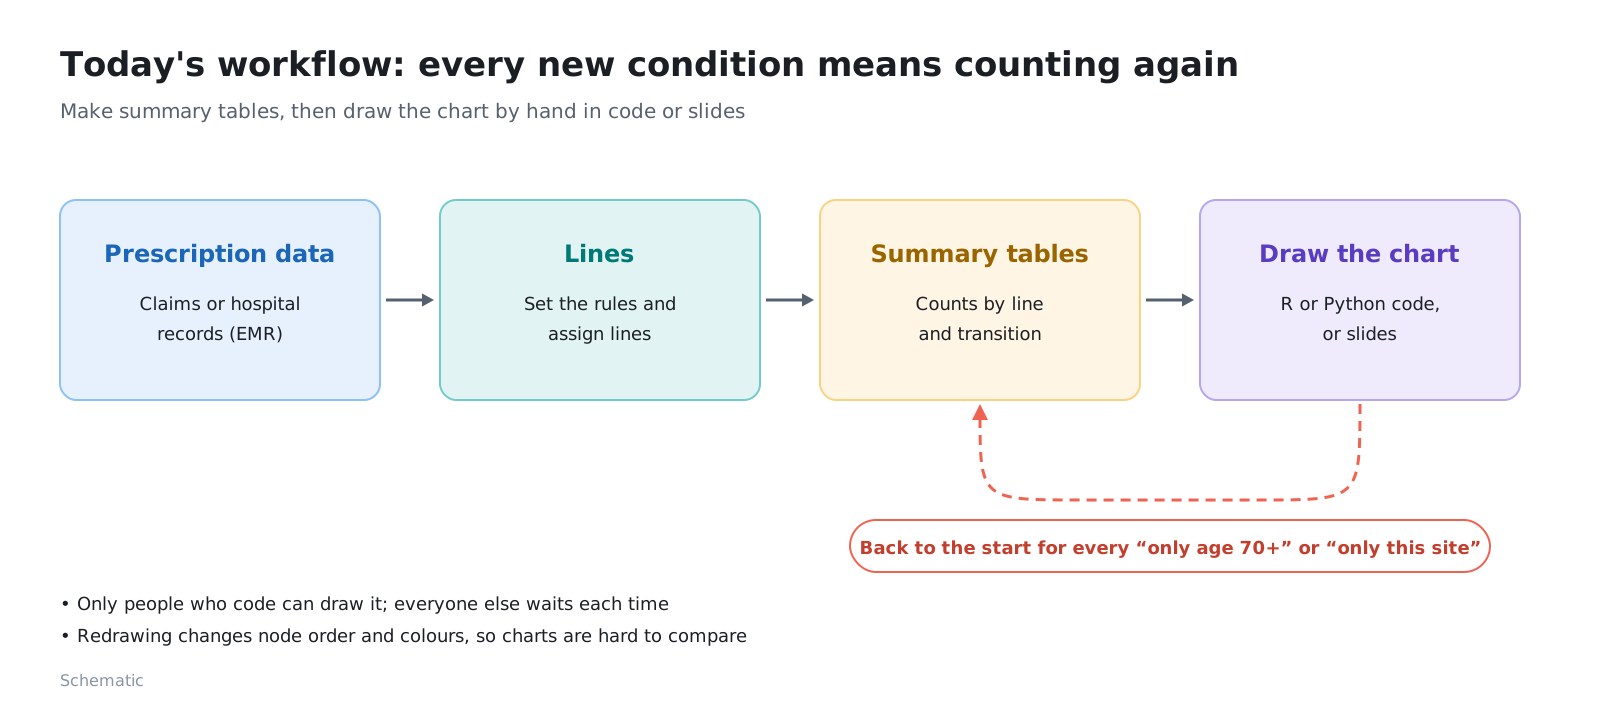
This approach has the following limits.
- Charts require code: Sankey diagrams are hard to draw in spreadsheet software or in-house BI tools, so they are often drawn by writing code with chart libraries in R or Python. The data also have to be reshaped into “from where, to where, how many”
- Flows cannot be read from tables: even with many tables by line and by transition side by side, it is hard to see “where most patients moved from and to”
- Every change of conditions means re-aggregating: each time you narrow down to “only patients aged 70 or over” or “only this institution,” the aggregation and the chart are redone
- Name variants are fixed by hand: differences in how each institution writes names are made consistent by hand while looking at tables
- Few tools can hold the data: prescription data can almost never be loaded into external services or into in-house BI that many people can access
6-2. Turning it into a chart and focusing by clicking
These limits can be reduced in the following way.
- Line boundaries are decided by those who prepare the data: the chart tool concentrates on receiving columns with lines already divided and showing them
- Click the chart to focus: pressing a band or bar redraws the chart for that patient group only. Order and colours stay as they were before focusing, so the charts are easy to compare
- The data never leave your machine: all aggregation happens on the user’s own computer
- AI helps with the preparation: for tasks that can be done without looking at individual patient records, such as column mapping and merging name variants, the AI is given only the column names and regimen names, makes proposals, and people check them and decide
The Treatment Line Sankey Diagram introduced in this series is a tool of this kind. Use its results as an aid to understanding treatment pathways, and carry out research analyses and final decisions according to your own procedures.
7. Primary sources
- Hess et al. (Future Oncology, 2021) — rules for dividing regimens and lines in oncology RWD (how a regimen is defined, adding and stopping drugs, length of treatment gaps)
- Grady et al. (Pharmacoepidemiology and Drug Safety, 2024) — proposed six rules for lung cancer; assignments differed from earlier rules in 5.7% of cases
- Hripcsak et al. (PNAS, 2016) — compared treatment sequences for diabetes, hypertension and depression across many databases within the OHDSI framework
- Matsson et al. (ACR Open Rheumatology, 2024) — followed treatment sequences in rheumatoid arthritis in a US registry; also touches on the limits of how Sankey diagrams present them
- Miyashiro et al. (Drugs - Real World Outcomes, 2024) — followed the use of and switching between biologics and JAK inhibitors in rheumatoid arthritis using Japanese hospital data
8. Summary
- A line of therapy is the order counted as first-line, second-line and so on each time treatment is changed. The set of drugs used in one line is a regimen
- Clinical records do not state lines, so they are divided by rules. There is no fixed definition, and changing the rules changes the assignments
- What you can and cannot see depends on the type of RWD. Hospital data cannot see treatment at other medical institutions
- Medical affairs, marketing, RWE and epidemiology, and HTA and market access use it to understand actual treatment practice
- In a Sankey diagram, bars are regimens, bands are transitions and width is the number of patients. Watch out for the base, how regimens are grouped, what it means when there is no next band, the fact that a band only remembers one step back, and name variants
- Today, summary tables and charts drawn with code or in slides are common, and they are redone every time the conditions change
Next steps
The main articles of the series introduce the Treatment Line Sankey Diagram, a tool that turns treatment pathways into a Sankey diagram just by loading analysis data and lets you focus on patient groups by clicking, together with how we developed it with Claude Code. We look in turn at loading the data, designing the chart, verifying the results and what to pass to the AI.
Sources
- Hess LM, Li X, Wu Y, Goodloe RJ, Cui ZL. Defining treatment regimens and lines of therapy using real-world data in oncology. Future Oncology. 2021. https://pubmed.ncbi.nlm.nih.gov/33629590/
- Grady CB, Hwang WT, Reuss JE, et al. Determining Line of Therapy from Real-World Data in Non-Small Cell Lung Cancer. Pharmacoepidemiology and Drug Safety. 2024;33(12):e70049. https://doi.org/10.1002/pds.70049
- Hripcsak G, Ryan PB, Duke JD, et al. Characterizing treatment pathways at scale using the OHDSI network. PNAS. 2016;113(27):7329-36. https://doi.org/10.1073/pnas.1510502113
- Matsson A, Solomon DH, Crabtree MM, et al. Patterns in the Sequential Treatment of Patients With Rheumatoid Arthritis Starting a Biologic or Targeted Synthetic Disease-Modifying Antirheumatic Drug: 10-Year Experience From a US-Based Registry. ACR Open Rheumatology. 2024;6(1):5-13. https://doi.org/10.1002/acr2.11621
- Miyashiro M, Asano T, Ishii Y, et al. Treatment Patterns of Biologic Disease-Modifying Antirheumatic Drugs and Janus Kinase Inhibitors in Patients with Rheumatoid Arthritis in Japan: A Claims-Based Cohort Study. Drugs - Real World Outcomes. 2024;11(2):285-297. https://doi.org/10.1007/s40801-024-00423-4
- The figures and screenshots on this page were produced with fictitious rheumatoid arthritis data. They are not related to any real patient, institution, drug or company